Candlestick patterns are among the most powerful tools in technical analysis, providing visual insights into market sentiment and potential price reversals. For traders using AI-assisted analysis, understanding these patterns adds a crucial layer of confirmation to algorithmic signals, helping filter out weak setups and identify high-probability entries.
What Candlestick Patterns Tell Us
Every candlestick tells a story about the battle between buyers and sellers during a specific time period. The body shows the opening and closing prices, while the wicks (shadows) reveal the high and low points. When combined into patterns, these individual candles create powerful narratives about market psychology and momentum shifts.
The key insight is that candlestick patterns work best as confirmation tools rather than standalone signals. When our AI analysis identifies a potential trade setup, checking for supporting candlestick patterns can significantly improve the probability of success.
Essential Reversal Patterns
Doji Patterns
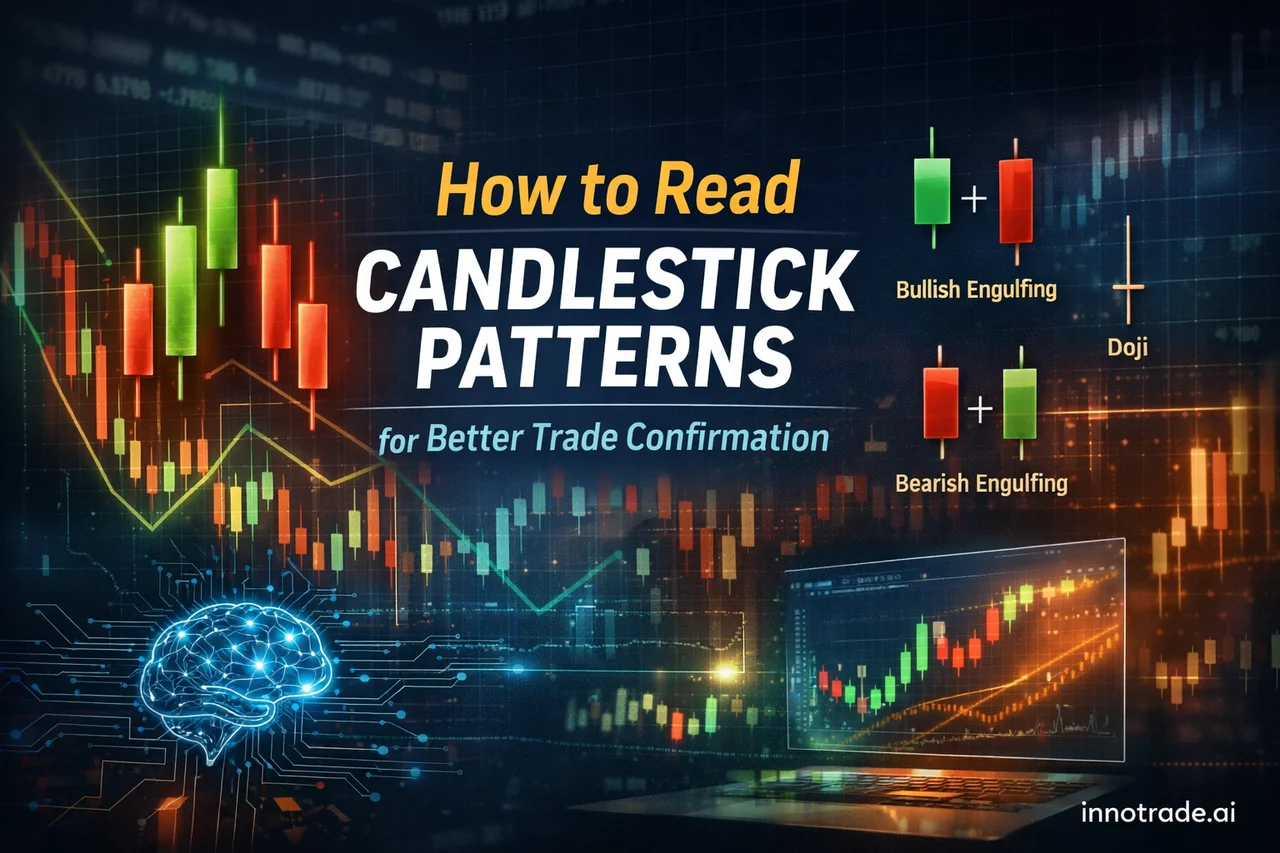
A doji forms when the opening and closing prices are nearly identical, creating a cross-like appearance. This pattern signals market indecision and potential reversal, especially at key support or resistance levels.
- Standard Doji: Equal upper and lower shadows, indicating perfect balance between bulls and bears
- Gravestone Doji: Long upper shadow with no lower shadow, suggesting rejection of higher prices
- Dragonfly Doji: Long lower shadow with no upper shadow, indicating rejection of lower prices
In practice, when our platform's AI identifies a potential reversal setup and a doji appears at the expected turning point, this confluence provides strong confirmation for the trade.
Hammer and Hanging Man
These patterns feature small bodies with long lower shadows (at least twice the body length). A hammer appears after a downtrend and suggests bullish reversal, while a hanging man appears after an uptrend and warns of potential bearish reversal.
The color of the body matters less than the overall structure, but bullish hammers (green/white bodies) and bearish hanging men (red/black bodies) provide stronger signals.
Engulfing Patterns
Bullish engulfing occurs when a large green candle completely engulfs the previous red candle's body. Bearish engulfing is the opposite. These patterns signal strong momentum shifts and work particularly well when they appear after extended moves.
Recent platform data shows that AI analysis performed exceptionally well when engulfing patterns confirmed the algorithmic signals, with our strongest trading day this week achieving a 57.1% win rate and 2.43 average risk-reward ratio, largely driven by well-confirmed reversal setups.
Continuation Patterns
Three White Soldiers and Three Black Crows
Three consecutive candles in the same direction, each opening within the previous candle's body and closing at new highs (white soldiers) or lows (black crows). These patterns indicate strong trend continuation.
Rising and Falling Three Methods
A long candle followed by three smaller counter-trend candles, then another long candle in the original direction. This pattern suggests a brief pause before trend continuation.
Pattern Context and Confirmation
The most critical aspect of candlestick analysis is context. The same pattern can have vastly different implications depending on:
- Location: Patterns at support/resistance levels carry more weight
- Volume: Higher volume strengthens pattern reliability
- Market structure: Patterns align better with the broader trend
- Multiple timeframes: Patterns appearing across different timeframes increase confidence
This is where AI-assisted trading provides a significant advantage. While human traders might struggle to process multiple variables simultaneously, our platform's analysis can identify when candlestick patterns align with technical indicators, support/resistance levels, and overall market structure in real-time.
Integrating Patterns with AI Analysis
The most effective approach combines algorithmic precision with pattern recognition. Here's how to integrate both:
Step 1: AI Signal Generation
Let the AI identify potential setups based on technical indicators, price action, and market structure.
Step 2: Pattern Confirmation
Check if supportive candlestick patterns are forming at the suggested entry levels. Look for patterns that align with the AI's directional bias.
Step 3: Risk Assessment
Use pattern completion points to refine stop-loss placement. For example, if a hammer pattern confirms a bullish AI signal, place the stop-loss below the hammer's low.
Step 4: Profit Target Validation
Consider how pattern-based price projections align with the AI's suggested take-profit levels (TP1, TP2, TP3).
Over the past week, this combined approach has proven particularly effective, with our platform maintaining solid performance even during mixed market conditions. The integration of pattern confirmation helped filter out lower-probability setups, contributing to more consistent results across various trading instruments.
Common Mistakes to Avoid
Pattern Obsession: Not every price movement forms a meaningful pattern. Focus on clear, well-formed patterns that appear at significant levels.
Ignoring Context: A bullish hammer in a strong downtrend is less reliable than one appearing at a key support level.
Single Timeframe Analysis: Always check how patterns look across multiple timeframes. A pattern on the 5-minute chart should ideally align with the broader structure on the hourly or daily charts.
Forcing Patterns: Sometimes the market doesn't provide clear patterns. It's better to wait for high-quality setups than force trades on ambiguous formations.
Advanced Pattern Recognition
As you develop proficiency with basic patterns, consider learning complex formations like:
- Morning and Evening Stars: Three-candle reversal patterns
- Harami Patterns: Inside day formations suggesting indecision
- Tweezers: Two candles with similar highs or lows at turning points
The Trading Academy provides structured learning paths for developing these advanced skills, complementing the real-time pattern recognition capabilities of our AI analysis platform.
Practical Application
Start by focusing on 2-3 patterns and master them before expanding your repertoire. Track how these patterns perform when combined with AI signals versus when they appear in isolation. Most traders find that the combination significantly improves their win rates and risk-reward ratios.
Remember that candlestick patterns are probabilistic, not predictive. They increase the odds of success when properly applied but don't guarantee outcomes. The goal is to stack probabilities in your favor by combining multiple forms of confirmation.
For those serious about improving their pattern recognition skills, consider using the Trade Tracking dashboard to monitor which pattern-AI combinations work best for your trading style and preferred instruments. This data-driven approach to skill development accelerates the learning process and helps identify your most profitable setups.
Analytical software only. We do not handle funds, make investments, or provide financial advice. Trading involves substantial risk and past performance does not guarantee future results. Always conduct your own research and consider your risk tolerance before making trading decisions.