Support and resistance levels represent the most fundamental concepts in technical analysis, yet they remain among the most powerful tools for making trading decisions. These psychological and technical price levels act as invisible barriers where buying and selling pressure collides, creating predictable market behavior that smart traders exploit.
What Are Support and Resistance Levels?
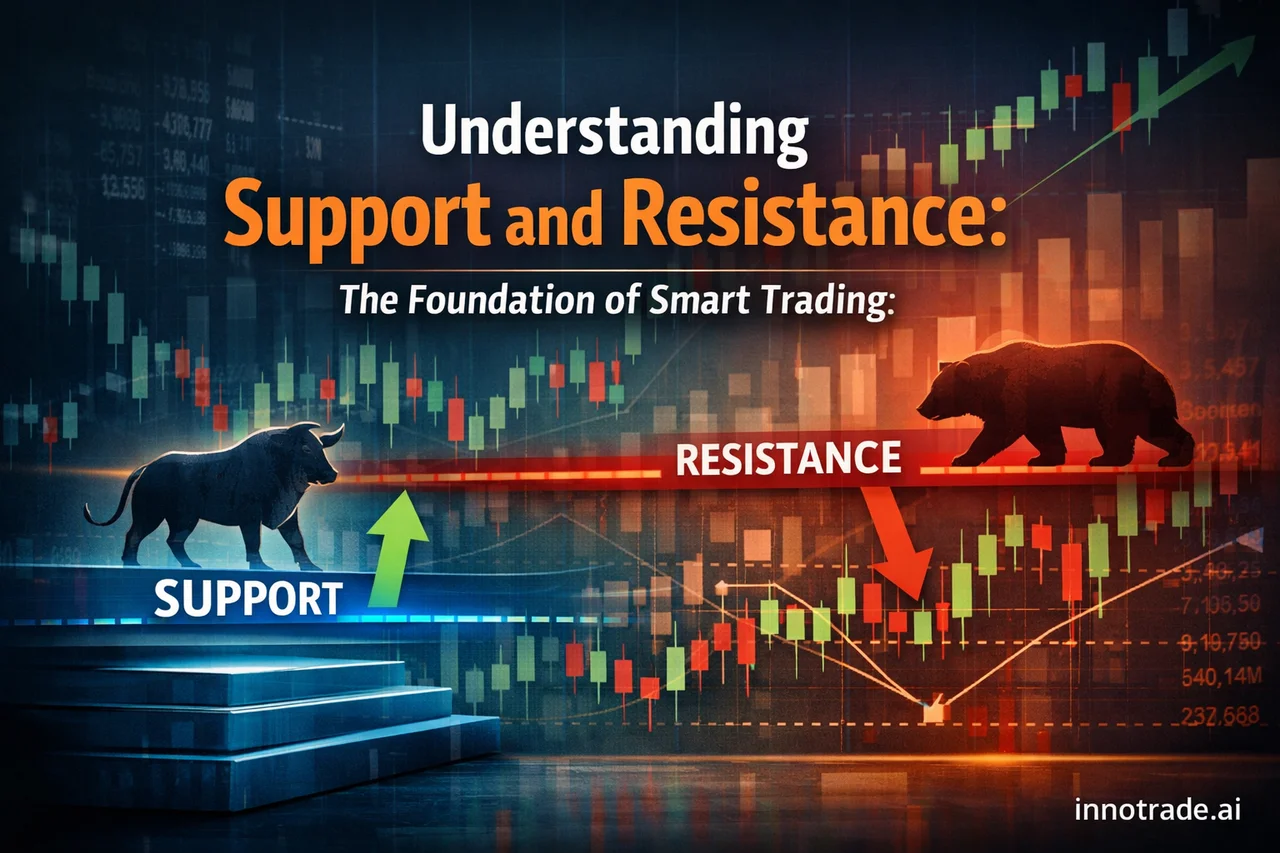
Support is a price level where demand consistently emerges, preventing further downward movement. Think of it as a floor beneath price action where buyers step in with enough force to halt or reverse a decline.
Resistance is the opposite—a ceiling where selling pressure overwhelms buying interest, preventing upward progress. These levels represent psychological price points where traders historically made significant decisions.
Consider XAUUSD (gold), one of our most actively analyzed instruments. Over the past two weeks, gold has demonstrated classic support and resistance behavior around key psychological levels. When AI analysis identifies these zones early, traders gain a significant edge in timing their entries and exits.
Types of Support and Resistance
Horizontal Support and Resistance
The most obvious type occurs at specific price levels where multiple touches create clear lines. These often coincide with round numbers—$2000 for gold, 1.1000 for EUR/USD, or $100,000 for Bitcoin. Market psychology gravitates toward these clean figures.
Dynamic Support and Resistance
Moving averages, trend lines, and channels create dynamic levels that move with price. A rising trend line acts as dynamic support during an uptrend, while a descending moving average provides dynamic resistance in a downtrend.
Volume-Based Levels
Price levels where significant volume occurred historically often act as future support or resistance. These represent areas where large institutional players made major position changes.
How to Identify Strong Support and Resistance
Not all support and resistance levels carry equal weight. The strongest levels share specific characteristics:
- Multiple touches: The more times price respects a level without breaking through, the stronger it becomes
- Time significance: Levels that held importance across different timeframes carry more weight
- Volume confirmation: High volume at a level indicates institutional interest
- Round numbers: Psychological levels ending in 00, 50, or other clean figures
- Previous swing highs/lows: Where price previously reversed direction
Our AI analysis incorporates these factors when identifying potential reversal zones. The algorithms scan multiple timeframes simultaneously, identifying confluences where several support or resistance factors align—creating high-probability trade setups.
Trading Support and Resistance Effectively
The Bounce Strategy
When price approaches a strong support level, look for buying opportunities as it bounces higher. Similarly, resistance levels offer short-selling opportunities as price rejects and moves lower. This works best when combined with additional confirmation signals.
Recent platform data shows this approach working particularly well on major forex pairs. Our weekly analysis reveals that trades taken near identified support and resistance zones achieved notably higher success rates, with the strongest day this period generating an impressive EV score of 1.14—largely driven by successful resistance-based entries on currency pairs.
The Breakout Strategy
Sometimes support becomes resistance, and resistance becomes support after a decisive break. When price breaks through a significant level with strong volume, the broken level often flips its role. A former resistance level that gets broken tends to act as future support.
This concept proves especially valuable in cryptocurrency analysis, where BTCUSD frequently demonstrates clean breakout behavior around key technical levels.
False Breakouts and Whipsaws
Not every break through support or resistance leads to continued movement. False breakouts occur when price briefly penetrates a level before quickly reversing back. Smart traders use these as fade opportunities, betting against the breakout.
Using AI Analysis for Support and Resistance Trading
Modern AI analysis excels at identifying support and resistance levels because algorithms can process vast amounts of historical price data instantaneously. They recognize patterns across multiple timeframes and instruments simultaneously—something impossible for human analysis alone.
When using AI-generated analysis, pay attention to how support and resistance levels align with the suggested entry points and take-profit targets. Strong analysis often places TP1 levels just before the next significant resistance (for long trades) or support (for short trades).
The three-tier take-profit structure (TP1, TP2, TP3) naturally incorporates support and resistance concepts. TP1 typically targets the nearest significant level, while TP2 and TP3 aim for more distant zones where price might encounter selling or buying pressure.
Common Mistakes to Avoid
Drawing Too Many Lines
Novice traders often identify so many support and resistance levels that their charts become cluttered and confusing. Focus on the most obvious, well-tested levels rather than every minor swing point.
Ignoring Timeframe Context
A support level on a 5-minute chart carries less significance than one on a daily or weekly timeframe. Always consider the broader market structure when evaluating the strength of a level.
Expecting Perfect Precision
Support and resistance work as zones, not exact price points. Price might overshoot or undershoot a level by several pips before the expected reaction occurs. Build this flexibility into your trading plan.
Practical Application with Risk Management
When trading around support and resistance levels, proper risk management becomes crucial. Place stop-losses beyond the level you're trading from—if price breaks decisively through your support or resistance zone, your thesis was wrong and you should exit.
For example, if buying at support around 1.0950 on EUR/USD, place your stop-loss below 1.0920 (beyond the support zone). This gives the trade room to breathe while limiting downside risk if the level fails to hold.
The beauty of support and resistance trading lies in the favorable risk-reward ratios it often provides. When you buy near strong support with a nearby stop-loss, you can target multiple resistance levels above—potentially achieving 2:1 or 3:1 reward-to-risk ratios on successful trades.
Integration with Other Technical Tools
Support and resistance work best when combined with other technical analysis methods. RSI divergence at a resistance level, or oversold conditions at support, can strengthen your conviction in a trade setup.
Candlestick patterns also provide valuable confirmation. A hammer or doji at support suggests potential reversal, while a shooting star at resistance indicates possible rejection.
Our ScalpHunter system excels at identifying these confluences in real-time, sending alerts when multiple technical factors align around key support and resistance zones.
Support and resistance analysis forms the foundation upon which all other technical analysis builds. Master these concepts, and you'll develop an intuitive understanding of market structure that serves you across all timeframes and instruments. The key lies not just in identifying these levels, but in understanding the market psychology that makes them work—and using tools like AI analysis to validate your observations with data-driven precision.
Analytical software only. We do not handle funds, make investments, or provide financial advice. Trading involves substantial risk and past performance does not guarantee future results. Always conduct your own research and consider your risk tolerance before making trading decisions.