Currency correlation is one of the most powerful yet underutilized concepts in forex trading. Understanding how different currency pairs move in relation to each other can dramatically improve your risk management, help you avoid overexposure, and even identify high-probability trading opportunities that single-pair analysis might miss.
What Is Currency Correlation?
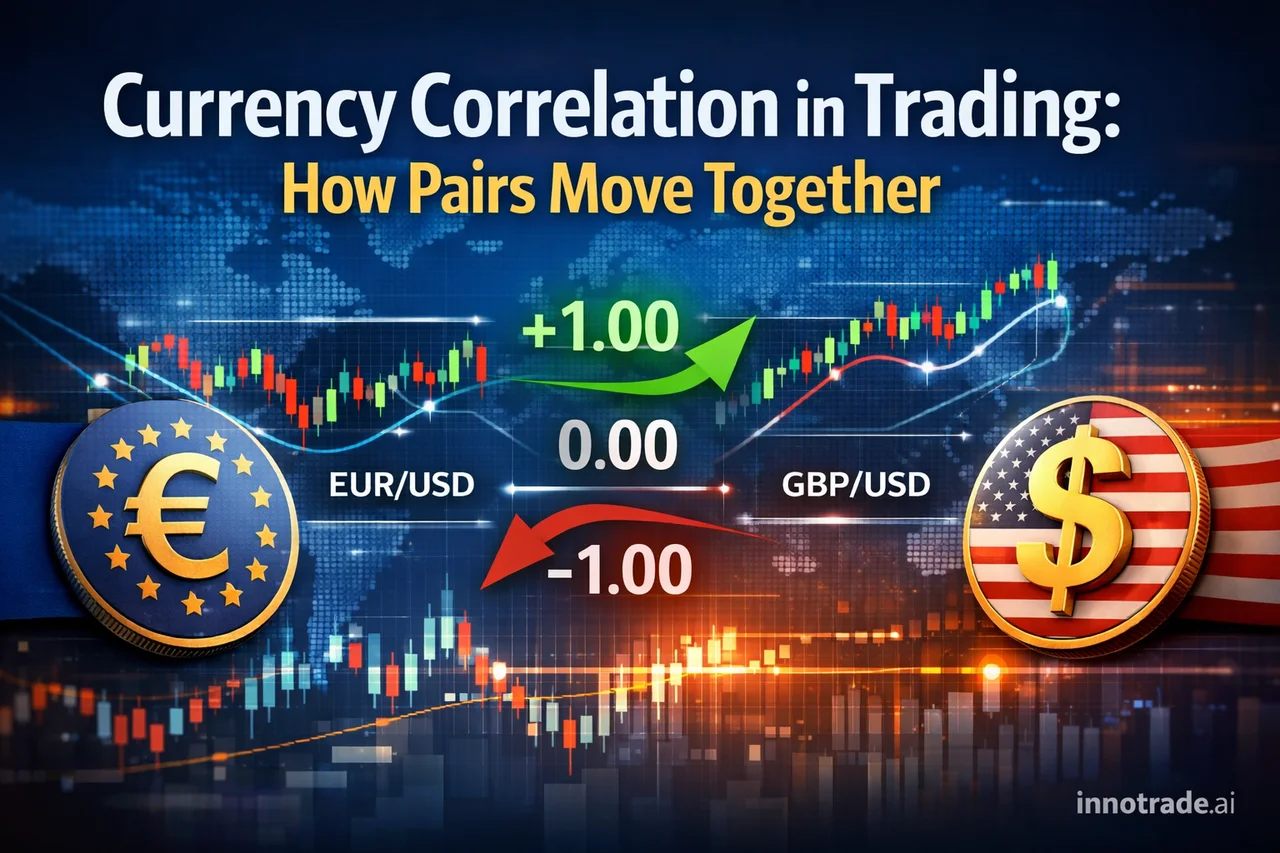
Currency correlation measures how closely two currency pairs move together over time. The correlation coefficient ranges from -1 to +1, where:
- +1 (Perfect Positive Correlation): Pairs move in exactly the same direction
- 0 (No Correlation): Pairs move independently of each other
- -1 (Perfect Negative Correlation): Pairs move in exactly opposite directions
For example, EUR/USD and GBP/USD typically show positive correlation because both pairs share the USD as the quote currency and often react similarly to USD strength or weakness. Conversely, EUR/USD and USD/CHF usually demonstrate negative correlation since USD strength benefits USD/CHF but hurts EUR/USD.
The Major Currency Correlation Groups
Positive Correlation Pairs
These pairs tend to move in the same direction:
- EUR/USD and GBP/USD: Both decline when USD strengthens
- AUD/USD and NZD/USD: Commodity currencies that react similarly to risk sentiment
- EUR/JPY and GBP/JPY: Both benefit from JPY weakness and risk-on sentiment
Negative Correlation Pairs
These pairs typically move in opposite directions:
- EUR/USD and USD/CHF: Classic inverse relationship
- GBP/USD and USD/JPY: Often move opposite due to risk sentiment differences
- AUD/USD and USD/JPY: Commodity currency vs safe haven dynamics
How AI Analysis Leverages Correlation Data
Modern AI trading systems excel at processing correlation relationships across multiple timeframes simultaneously. When analyzing EUR/USD, sophisticated algorithms don't just look at that pair in isolation—they consider how GBP/USD, USD/CHF, and other correlated instruments are behaving.
Recent platform performance data shows this multi-pair approach delivering consistent results. Over the past week, the AI analysis averaged a 59.1% win rate across tracked trades, with an average risk-reward ratio of 1.89. The strongest day this period was Monday, May 25, with an EV score of 1.54, where correlation analysis likely helped identify setups where multiple EUR and GBP pairs aligned with the same directional bias.
Practical Correlation Trading Strategies
Strategy 1: Correlation Confirmation
Use positively correlated pairs to confirm trade signals. If your analysis suggests EUR/USD will rise, check whether GBP/USD is showing similar bullish signals. When both pairs align, it increases confidence in the USD weakness thesis.
Example Setup: EUR/USD breaks above resistance while GBP/USD simultaneously breaks its own resistance level. This dual confirmation suggests broad-based USD weakness rather than EUR-specific strength.
Strategy 2: Divergence Opportunities
When normally correlated pairs diverge significantly, it often creates mean reversion opportunities. If EUR/USD and GBP/USD typically correlate at 0.80 but suddenly diverge, one pair may be overextended.
Strategy 3: Risk Diversification
Avoid taking multiple positions in highly correlated pairs simultaneously. Trading both EUR/USD and GBP/USD long is essentially doubling your USD short exposure, not diversifying it.
Correlation Changes During Market Events
Currency correlations aren't static—they shift based on market conditions, economic events, and risk sentiment. During major news events, correlations can strengthen or weaken dramatically.
High-Impact News: When the Federal Reserve announces policy changes, USD-based correlations typically strengthen as all USD pairs react to the same fundamental driver.
Risk-Off Events: During market stress, safe haven correlations dominate. JPY and CHF pairs often decouple from their normal patterns as flight-to-quality flows take over.
The AI analysis system continuously adapts to these changing correlation dynamics, helping identify when traditional relationships break down and new opportunities emerge.
Using Correlation Matrices Effectively
A correlation matrix displays correlation coefficients between multiple currency pairs in an easy-to-read grid format. Here's how to interpret and use them:
- Check timeframe relevance: 1-hour correlations differ from daily correlations
- Monitor correlation strength: Values above 0.70 indicate strong correlation
- Watch for breakdown signals: Sudden correlation changes often precede major moves
- Consider portfolio impact: Calculate your net exposure across correlated positions
Common Correlation Trading Mistakes
Mistake 1: Assuming Constant Correlation
Many traders treat correlation as fixed, but it fluctuates constantly. What was a 0.85 correlation last month might be 0.45 today due to changing market dynamics.
Mistake 2: Over-Diversification Illusion
Taking five different EUR-based positions isn't diversification—it's concentrated EUR exposure. True diversification requires understanding underlying currency exposures.
Mistake 3: Ignoring Correlation in Risk Management
Position sizing that ignores correlation can lead to unexpected portfolio risk. Two 1% risk trades in highly correlated pairs might actually represent 1.8% combined risk.
Implementing Correlation Analysis in Your Trading
Start by tracking the correlation coefficients of your most-traded pairs over different timeframes. Many platforms provide correlation data, but understanding the relationships conceptually is more important than memorizing exact numbers.
Focus on these actionable steps:
- Identify your core correlation groups: Know which pairs typically move together in your portfolio
- Monitor correlation strength: Use correlation data to gauge when relationships are unusually strong or weak
- Adjust position sizing: Reduce individual position sizes when trading multiple correlated pairs
- Look for divergence setups: When correlated pairs diverge unusually, investigate potential mean reversion trades
The Trading Academy provides additional resources on correlation analysis and other risk management concepts that can enhance your trading edge.
Advanced Correlation Concepts
Cross-Asset Correlations
Currency correlations extend beyond forex pairs. Commodity currencies like AUD and CAD often correlate with oil and gold prices. Understanding these relationships helps predict currency movements based on commodity trends.
Interest Rate Correlations
Currency pairs often correlate with interest rate differentials between their respective countries. When rate differentials widen, carry trade dynamics can override normal correlation patterns.
Technology's Role in Correlation Trading
Modern AI systems process thousands of correlation calculations simultaneously, identifying subtle relationship changes that human traders might miss. This technological edge becomes particularly valuable during volatile periods when correlations shift rapidly.
For traders looking to leverage these advanced capabilities, exploring platform features that incorporate correlation analysis can provide a significant analytical advantage in today's complex markets.
Currency correlation analysis transforms forex trading from a series of isolated pair decisions into a comprehensive portfolio management approach. By understanding how pairs relate to each other, traders can better manage risk, identify high-probability setups, and avoid the costly mistake of inadvertent overexposure to single currency movements.
Analytical software only. We do not handle funds, make investments, or provide financial advice. Trading involves substantial risk and past performance does not guarantee future results. Always conduct your own research and consider your risk tolerance before making trading decisions.