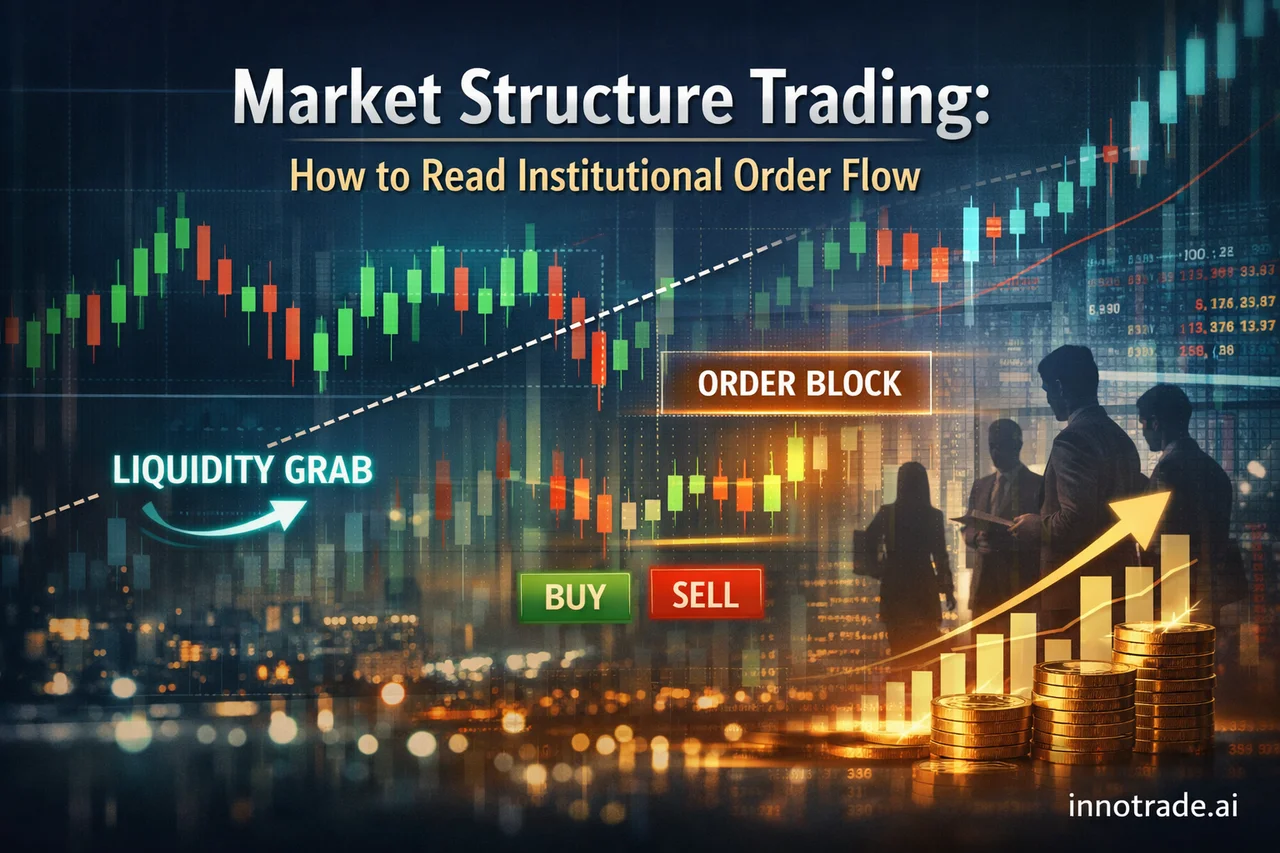
Market structure analysis has become the cornerstone of modern trading education, moving far beyond traditional technical analysis to focus on how institutional players actually move markets. Understanding these concepts—market structure breaks, liquidity grabs, order blocks, and displacement moves—gives retail traders insight into the "why" behind price movements, not just the "what."
What is Market Structure?
Market structure refers to the framework of higher highs, higher lows, lower highs, and lower lows that define trending and ranging markets. However, modern market structure analysis goes deeper, examining how institutional order flow creates specific patterns that retail traders can recognize and trade alongside.
The key insight is that large institutional orders—hedge funds, banks, market makers—cannot be filled at a single price point without causing massive slippage. Instead, they must accumulate or distribute positions over time, creating predictable footprints in the price action.
Market Structure Break (MSB) Confirmation
A market structure break occurs when price violates a significant high or low, signaling a potential change in trend direction. However, not all breaks are created equal. True institutional breaks typically exhibit three characteristics:
- Strong displacement: The break occurs with high momentum, often creating gaps or long wicks
- Volume confirmation: Increased trading activity accompanies the break
- Follow-through: Price continues in the break direction rather than immediately reversing
When analyzing recent market data, the strongest performing setups often align with clean market structure breaks. Monday, May 25 demonstrated this perfectly with an EV score of 1.54—the highest of the week—where setups consistently identified genuine structural shifts rather than false breakouts.
Liquidity Grab Patterns
Before creating genuine moves, institutions often "grab liquidity" by briefly pushing price beyond obvious levels where retail stop-losses cluster. These areas include:
- Previous day highs and lows
- Round number levels (1.3000, 2000.00)
- Obvious swing highs and lows
- Equal highs or equal lows
The liquidity grab typically appears as a spike beyond these levels followed by an immediate reversal. This "stop hunt" clears out retail positions before the real institutional move begins in the opposite direction.
"The best entries often come after the market has swept obvious levels and retail traders have been stopped out. That's when institutions begin their actual accumulation or distribution."
Order Blocks and Institutional Entry Zones
Order blocks represent areas where institutions placed large orders, creating imbalances that price often returns to fill. These appear as:
- Bullish order blocks: The last bearish candle before a strong bullish displacement move
- Bearish order blocks: The last bullish candle before a strong bearish displacement move
When price returns to test an order block, it's often seeking to fill remaining institutional orders at those levels. The key is identifying which order blocks are still "fresh" (untested) versus those that have already been "consumed" by price returning to them.
Order Block Validation Criteria
Not every order block will hold when tested. Strong order blocks typically feature:
- Clear displacement away from the zone
- Multiple timeframe confluence
- Alignment with broader market structure
- Proximity to key liquidity levels
Fair Value Gaps (FVG) Trading Strategy
Fair Value Gaps occur when price moves so quickly that it leaves inefficiencies—gaps between the high of one candle and the low of another. These gaps often get filled as price returns to restore balance.
There are three types of FVGs:
- Bullish FVG: Gap created during upward price movement
- Bearish FVG: Gap created during downward price movement
- Breaker FVG: A failed order block that becomes a gap to be filled
The most reliable FVG trades occur when the gap aligns with other institutional concepts—order blocks, market structure levels, or liquidity zones.
Change of Character (ChoCh) Signals
Change of Character represents a shift in market behavior from trending to ranging or vice versa. This occurs when:
- An uptrend fails to create a new higher high
- A downtrend fails to create a new lower low
- Price begins creating opposing structure (higher lows in a downtrend)
Recognizing ChoCh early allows traders to adapt their strategy before the broader market catches on. Recent platform data shows that adaptability during structural shifts significantly impacts performance—Wednesday, May 27 achieved a 63.6% win rate as setups successfully identified character changes across multiple instruments.
Displacement Moves and Momentum Confirmation
Displacement moves represent institutional "smart money" entering the market aggressively. These moves exhibit:
- Strong momentum with minimal retracement
- Breaking through multiple levels without hesitation
- Often occurring during key trading sessions
- Creating the foundation for new market structure
The strength of displacement often determines whether a setup will reach extended targets. Over the past week, setups aligned with strong displacement moves showed notably better progression through multiple take-profit levels.
Premium and Discount Pricing Models
Institutional traders think in terms of premium and discount pricing:
- Premium: Upper portion of a range where selling is favored
- Discount: Lower portion of a range where buying is favored
- Equilibrium: Middle ground where directional bias is unclear
This concept helps determine whether current prices represent value or if they're extended. Entries from discount levels in uptrends and premium levels in downtrends typically offer better risk-reward ratios.
Applying Market Structure with AI-Assisted Analysis
Modern AI trading tools excel at identifying these institutional patterns across multiple timeframes and instruments simultaneously. The key advantages include:
- Pattern recognition: Identifying market structure breaks and liquidity grabs in real-time
- Multi-timeframe analysis: Confirming setups across different time horizons
- Confluence detection: Finding where multiple institutional concepts align
- Risk management: Placing stops beyond true institutional levels, not obvious retail levels
The platform's all-time win rate of 54.0% with an average RR of 2.03 reflects this institutional approach to trade selection and management. By focusing on where smart money operates rather than where retail traders typically look, the analysis consistently identifies higher-probability setups.
Integration with Traditional Analysis
Market structure concepts don't replace traditional technical analysis—they enhance it. Support and resistance levels become more meaningful when viewed as institutional order zones. Trend lines gain significance when they represent true structural levels rather than arbitrary connections between highs and lows.
The most powerful setups occur when market structure analysis aligns with traditional technical signals, fundamental bias, and optimal timing within trading sessions.
Common Mistakes to Avoid
Traders new to market structure analysis often make these errors:
- Over-analyzing: Seeing patterns that don't exist or forcing concepts onto every price movement
- Ignoring timeframes: Focusing only on lower timeframes without higher timeframe context
- Chasing displacement: Entering after the institutional move rather than waiting for retracement
- Retail stop placement: Using obvious levels instead of true institutional invalidation points
For traders interested in developing these skills systematically, the Trading Academy provides structured lessons on market structure concepts with practical examples and risk management guidelines.
Building Your Market Structure Toolkit
Mastering institutional order flow requires consistent practice and observation. Start by:
- Identifying clear market structure on higher timeframes
- Marking key liquidity levels and order blocks
- Watching for displacement moves and character changes
- Practicing pattern recognition across different instruments
- Documenting which patterns produce the best results
The goal isn't to predict every market move, but to align with institutional flow when high-probability opportunities present themselves. This approach, combined with proper risk management and realistic expectations, forms the foundation of consistent trading performance.
Analytical software only. We do not handle funds, make investments, or provide financial advice. Trading involves substantial risk and past performance does not guarantee future results. Always conduct your own research and consider your risk tolerance before making trading decisions.