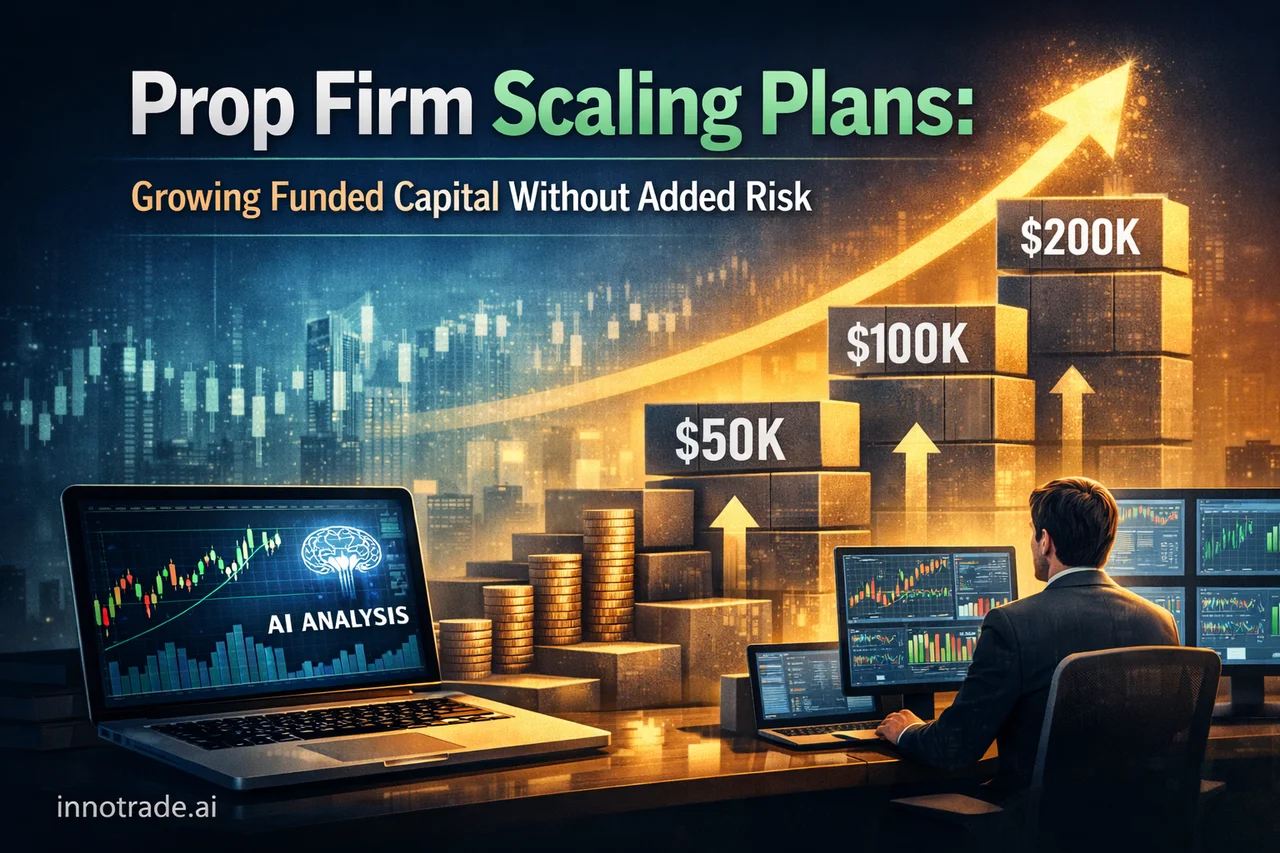
Most prop firm marketing focuses on the challenge itself — pass the evaluation, get funded, start trading. But the real long-term opportunity in funded trading isn't the first payout. It's the scaling plan: the mechanism most firms use to grow your allocated capital over time, often doubling or tripling your starting size across several profitable cycles. Scaling plans are rarely covered in depth because they reward something far less exciting than a lucky breakout — they reward boring, repeatable consistency.
This article looks at what scaling plans actually require, why most traders fail to qualify for them even after passing an evaluation, and how AI-assisted analysis can help you build the kind of stable, risk-managed track record scaling plans are designed to detect.
What a Scaling Plan Actually Measures
Scaling plans vary by firm, but the underlying logic is almost always the same: you need to hit a profit target over a defined number of cycles (commonly two to four consecutive profitable months) while staying within the firm's drawdown rules throughout. The firm isn't just checking whether you ended up green — it's checking whether your equity curve got there smoothly or through a few high-risk swings that happened to land in your favor.
This is where many funded traders stumble. They pass the evaluation with an aggressive approach, get funded, then keep trading the same way — and the variance that helped them pass starts working against them. A scaling plan effectively asks: can you repeat this performance without the volatility?
Why Consistency Is Harder Than It Sounds
Consistency isn't about avoiding losing trades — every strategy has them. It's about keeping your risk-reward profile stable across weeks and months so that your win rate and average RR don't swing wildly from one period to the next. That's a statistical discipline most discretionary traders underestimate, because it requires tracking performance at a level of detail most people don't bother with until they've already blown a scaling attempt.
Our own tracked data illustrates how much day-to-day variance is normal — and why judging performance from a single session is misleading. Over the past week, daily win rates on the platform ranged from a notably weak session early in the period up to a standout day on Monday, October 5, where the EV score reached its highest point of the week at 2.04. Tuesday, October 6 followed with a strong average RR of 2.49 and a similarly high EV score of 1.99, while Wednesday and Thursday settled into a more modest, realistic range with win rates of 40.0% and 25.0% respectively. Averaged across the full week, the data points to a win rate in the high-40s percentage range with an average RR near 1.9 — a far more representative figure than any single day in isolation.
That's the exact pattern a scaling plan is built to reward: not the one spectacular day, but the aggregated consistency across the full cycle.
Where AI-Assisted Analysis Fits Into a Scaling Strategy
AI-generated trade analysis won't make scaling automatic, and no honest platform should claim it will. What it can do is remove a major source of inconsistency: emotionally-driven entries, inconsistent stop placement, and risk-reward ratios that change based on how a trader feels that day rather than what the setup actually supports.
Every analysis on innotrade.ai includes a defined entry, three take-profit levels, and a stop-loss — the same structural discipline applied the same way, trade after trade. That structural consistency is what scaling plans are indirectly measuring. A trader who takes every setup with the same risk framework, rather than sizing up during a winning streak or revenge-trading after a loss, is the trader who survives the smoother equity curve a scaling plan demands.
It's also worth understanding what each TP level represents in that framework rather than treating them as a single outcome. TP1 is typically where a trader might take partial profit and move their stop to breakeven, reducing risk on the remainder of the position. TP2 and TP3 represent extended continuation targets, which is why win rates naturally decline at each successive level — fewer trades run far enough to reach the final target than reach the first. Understanding this decay is part of building realistic expectations rather than assuming every signal should run to its furthest target.
Watching the Full Picture, Not Just the Win Rate
A trader fixated on a single day's win rate will make poor sizing decisions. Saturday, October 3, for example, saw only a single tracked trade close unsuccessfully — a sample far too small to draw any conclusion from, yet a trader managing a funded account emotionally might overreact to a session like that by doubling position size the next day to "make it back." That's precisely the instinct a scaling plan punishes. The more useful signal is the broader weekly pattern, and even more broadly, the platform's all-time tracked win rate of 53.5% with an average RR of 2.04 — numbers that only become meaningful across hundreds of tracked trades, not single sessions.
This is also why Trade Tracking matters more for funded traders than almost any other feature. Reviewing your own historical hit rates, RR consistency, and strategy breakdowns over time is the only way to know whether you're actually trading in a way that would satisfy a scaling plan's requirements — rather than guessing based on how last week felt.
News Risk and Scaling Consistency
Scaling plans don't pause for high-impact news, and neither does the market. Events like Canada's Employment Change and Unemployment Rate releases — both high-importance data points that regularly move CAD pairs sharply — can wreck an otherwise consistent equity curve if position sizing isn't adjusted around them. Traders working toward a scale-up should treat news windows as a reason to either stand aside or reduce size, not as an opportunity to force a trade into volatility that doesn't match their usual risk profile.
The Takeaway
Scaling plans reward traders who can demonstrate the same risk discipline across many cycles, not the ones who produce the occasional outsized week. Aggregating your performance honestly — rather than anchoring to your best or worst day — is the only way to know if you're actually on track. For traders who want a transparent look at what consistent, structured analysis looks like over time, the Live Trades Scoreboard offers a public record of top-performing analyses as proof of past results, and the Trading Academy covers the underlying risk management concepts in more depth. If you're preparing for a scaling evaluation, start by reviewing your own numbers — not your best session, all of them — through a trial of structured, consistent analysis.
Analytical software only. We do not handle funds, make investments, or provide financial advice. Trading involves substantial risk and past performance does not guarantee future results. Always conduct your own research and consider your risk tolerance before making trading decisions.