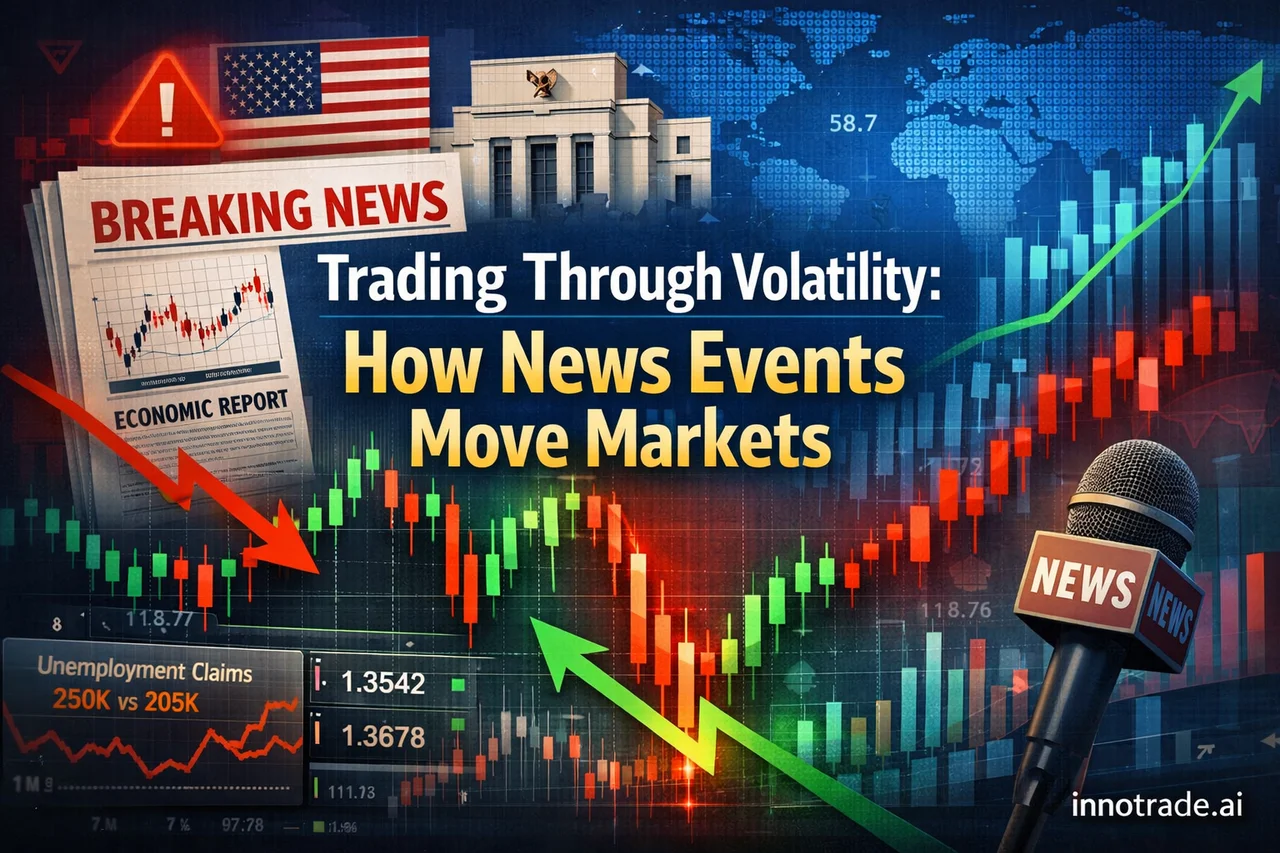
Every trader has experienced it: the chart is quiet, the spread is tight, and then a red-flagged news release hits the calendar. Within seconds, price snaps in one direction, the spread balloons, and an order that should have filled at one price fills somewhere else entirely. Understanding why this happens — and how to trade around it — is one of the most practical skills a retail trader can develop.
Why Economic News Events Move Markets
Markets price in expectations constantly. When a scheduled release — like an ISM Services PMI print or a Federal Reserve official's remarks — comes in different from forecast, liquidity providers and institutional desks reprice instantly. Our internal economic calendar, for example, tracks USD-sensitive events such as Unemployment Claims (forecast 205K vs. previous 203K) and ISM Services PMI (forecast 54.2 vs. previous 54.1). Even a modest surprise against these forecasts can trigger a sharp, short-lived repricing across USD pairs, indices, and even crypto markets that trade on risk sentiment.
Speeches from FOMC members — Goolsbee, Hammack, and Waller all appear regularly on the calendar — are officially labeled "low importance," but an unscripted comment on rate policy can still move USD pairs meaningfully within minutes. This is why experienced traders check the calendar before placing any trade, not just before entering during the news itself.
The Mechanics of Volatility: Spread, Slippage, and Execution
To trade through volatility responsibly, you need to understand three interconnected concepts:
- Bid vs. ask price: The bid is what you can sell at, the ask is what you can buy at, and the difference between them is the spread. In calm conditions this gap might be a fraction of a pip on a major pair. During a news release, liquidity providers widen it defensively — sometimes dramatically — because they're uncertain where fair value sits.
- Slippage: This is the difference between the price you requested and the price you actually got filled at. In fast-moving markets, by the time your order reaches the broker's server, price may have already moved past your intended entry. Slippage can work for or against you, but during news spikes it's almost always unfavorable for market orders.
- Market order vs. pending order: A market order executes immediately at whatever price is available — which is exactly what exposes you to slippage during volatility. A pending order (a limit order to enter at a better price, or a stop order to enter on a breakout) sits and waits, but during extreme volatility even these can suffer from gaps if price jumps clean through your level without trading at it.
The practical takeaway: if you don't need to be in a trade the second a release drops, waiting 5–15 minutes for spreads to normalize is often the more disciplined choice than chasing the initial spike.
Reading the Candles Before You Commit
Candlestick structure matters more during news than at any other time. A long wick with a small body typically shows the market rejected an extreme price and pulled back — a sign that chasing the initial move may be premature. A large body with minimal wick suggests strong directional conviction and follow-through. Waiting for a candle to close on your working timeframe before acting on a news spike is a simple habit that filters out a large share of false breakouts.
Position Sizing and Margin When Volatility Spikes
Pip value isn't uniform across currency pairs — a pip on USDJPY is worth a different amount than a pip on EURGBP or XAUUSD, and that difference compounds quickly when volatility widens your effective risk. This is exactly why a lot size calculator is a non-negotiable tool before entering any news-adjacent trade: it converts your account risk percentage into an appropriate position size given the pair's pip value and your stop distance.
Margin requirements also matter here. Brokers often increase margin requirements around high-impact events specifically because volatility raises the odds of rapid, large price swings. A position sized comfortably in calm conditions can suddenly consume a much larger share of available margin, so recalculating position size — not just relying on your usual lot size — is a habit worth building into your pre-news routine. Understanding these mechanics is core to any solid trading education, and it's covered in more depth in our Trading Academy.
Equity vs. Balance: What to Watch Mid-Trade
Your account balance only updates once a trade closes. Your equity, by contrast, reflects your balance plus or minus the floating result of any open positions in real time. During a volatile news window, equity can swing sharply even though balance hasn't moved at all — which is precisely why traders holding positions through scheduled releases should watch equity, not balance, to gauge real-time risk exposure. Reviewing this distinction inside your Trade Tracking dashboard after a volatile session is a useful way to see exactly how much your equity fluctuated relative to your eventual closed result.
How AI-Assisted Analysis Adapts to News-Driven Conditions
One of the advantages of a data-driven approach is that it doesn't get emotionally anchored to a single spike. Looking at the past week of tracked activity on the platform, performance varied meaningfully day to day — average win rate across the week sat near 62.8%, with an average risk-reward ratio around 2.26. The strongest session of the period was Tuesday, September 1, posting an 83.3% win rate and a 3.42 average RR, driven by cleaner directional follow-through. By contrast, Saturday, August 29 was the weakest session by EV score, with a 50.0% win rate and a 1.93 average RR — a reminder that even a data-driven process has quieter stretches, particularly around lower-liquidity weekend conditions.
This is also where transparency matters. Every analysis the platform generates is tracked and visible, and the top-performing setups across all users over the past two weeks are displayed openly on the Live Trades Scoreboard — a public, read-only record of past results, not a signal source. It exists purely so traders can verify that performance claims are backed by actual tracked outcomes rather than marketing language.
Practical Takeaway
Volatility around news events isn't something to avoid entirely — it's something to respect and prepare for. Before your next high-impact release:
- Check whether a market or pending order fits your intended entry, given the spread risk
- Recalculate position size using current pip value and margin requirements, not yesterday's numbers
- Wait for candle confirmation instead of reacting to the first tick
- Watch equity, not just balance, while a position is open through a release
If you want to see how AI-generated analysis factors in scheduled news risk alongside entries, targets, and stop-loss placement, you can review live setups on the Analysis page, or check common questions about execution and platform mechanics on our FAQ.
Analytical software only. We do not handle funds, make investments, or provide financial advice. Trading involves substantial risk and past performance does not guarantee future results. Always conduct your own research and consider your risk tolerance before making trading decisions.