Markets moved through a data-heavy week shaped by USD-driving events, a light EUR/GBP calendar, and steady CAD releases. Below is a transparent breakdown of how the platform's AI-generated analyses performed across the past seven days, which instruments dominated activity recently, and what the underlying data suggests for the week ahead.
This Week's AI Performance: A Steady, EV-Driven Week
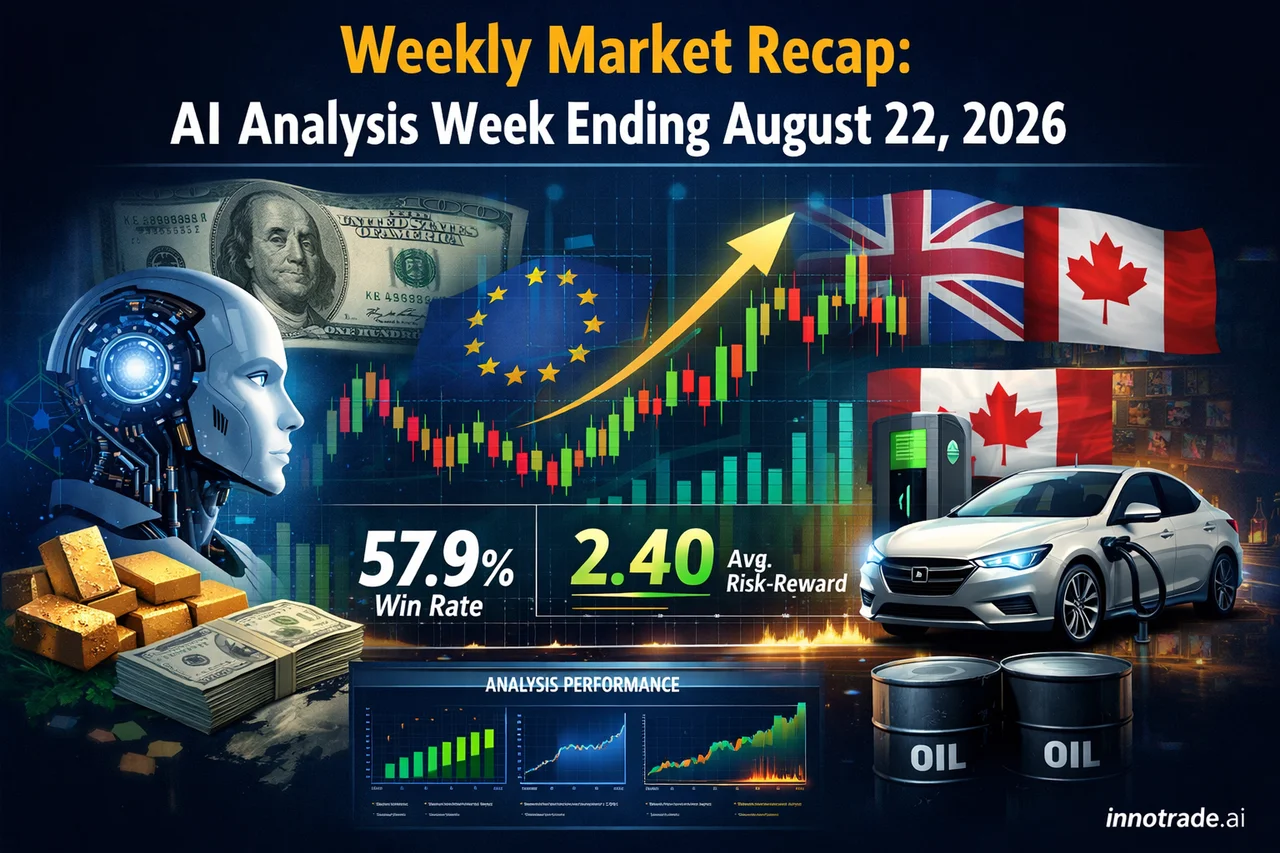
Aggregating the daily performance data from the week of August 15–21, the platform's AI analyses produced a weekly win rate of approximately 57.9% with a blended average risk-reward ratio of roughly 2.40. That combination — a win rate comfortably above breakeven paired with an RR well north of 2:1 — is exactly the profile that produces positive expected value over time, and it showed up clearly in the week's average EV score of around 0.91.
Rather than judging each day by win rate alone, we rank performance using EV score, which blends win rate and RR into a single measure of trade quality. By that metric, Monday, August 17 stood out as the strongest session of the week, posting a 60.0% win rate, a 2.63 average RR, and an EV score of 1.18 — the highest of the period. It was also the busiest day for tracked setups, suggesting that higher-volume sessions didn't come at the cost of quality.
On the other end, Sunday, August 16 was the weakest day by EV score, landing at 0.57 despite a respectable 54.5% win rate. The culprit was a thinner average RR of 1.88 — a reminder that win rate alone doesn't tell the full story. A day can post a solid hit rate and still underperform on an EV basis if the reward side of the equation compresses.
Why EV Score Beats Win Rate Alone
One of the more instructive comparisons this week came from Wednesday, August 19 versus Friday, August 21. Wednesday saw a lower win rate of 44.4% but a much wider average RR of 3.48, while Friday posted a higher win rate of 57.1% with a tighter 2.49 RR. Despite the very different win-rate profiles, both days landed at nearly identical EV scores of 0.99. This is the core lesson of expected value: a lower win rate with larger winners can be just as profitable, on paper, as a higher win rate with smaller ones. Traders who fixate purely on win rate often misjudge which days — or which strategies — actually add value. For a deeper look at how these mechanics work in practice, the Trading Academy covers risk-reward fundamentals in more detail.
Market Movers: Instruments in Focus
Looking over the past two weeks of tracked activity rather than just this week alone, a few instruments stood out for both volume and consistency. USDCAD was a standout performer, showing strong follow-through across all three take-profit levels with a comparatively low rate of stop-loss hits — a sign that trend conditions were well-aligned with the pairs' recent price action, likely influenced by the steady drip of Canadian retail sales data against a resilient USD backdrop.
XAUUSD was, by a wide margin, the most heavily analysed instrument over the past two weeks, reflecting gold's outsized role in a week dominated by USD-sensitive headlines. Volume was high, and early TP1 follow-through was solid, but the proportion of stop-loss hits relative to setups was also notably higher than USDCAD's — consistent with gold's tendency to whipsaw around macro headlines rather than trend cleanly. AUDJPY and BTCUSD told a similar story: decent initial TP1 engagement but a steeper drop-off into TP2 and TP3, alongside a higher share of stop-outs, pointing to choppier, less directional conditions in these pairs recently.
Key Economic Events That Shaped the Week
The macro calendar leaned USD-centric. President Trump's public remarks added a layer of headline risk that tends to ripple through USD pairs and gold in particular, while Flash Services and Flash Manufacturing PMI releases — both modestly beating prior readings — reinforced a narrative of resilient US economic activity. On the CAD side, Core Retail Sales and headline Retail Sales both showed a step-down in monthly growth versus the prior month, a detail that likely contributed to some of the choppiness seen in CAD pairs even as USDCAD's overall setups performed well. Meanwhile, GBP and EUR calendars were comparatively quiet, with Flash PMI readings for both regions coming in close to forecast — helping explain why AUDJPY and other cross pairs lacked the cleaner trends seen elsewhere.
What Traders Should Watch Next Week
- USD direction: With PMI data trending firm and political headlines still a wildcard, USD pairs — especially USDCAD and gold — remain the instruments to watch most closely.
- Gold volatility: XAUUSD's high setup volume combined with a heavier stop-out rate over the past two weeks suggests tighter risk management and realistic position sizing matter more than usual right now.
- Cross-pair choppiness: AUDJPY and similar crosses have shown weaker follow-through into deeper TP levels recently — a signal that trend-following approaches may need to be more selective in these pairs until conditions clarify.
- RR discipline: This week's data reinforced that a wider RR can offset a lower win rate. Traders should resist the urge to judge a strategy or a single day purely by hit rate.
The Takeaway
The week's numbers — a win rate near 58%, an average RR above 2.4, and an EV trend hovering just under 1.0 — reflect a market that rewarded patience and proper reward targeting over sheer frequency of wins. For traders who want to see this kind of analysis applied to live setups, the Analysis tool generates AI-driven entries with defined TP and stop-loss levels in real time, while Trade Tracking lets you monitor how your own trades stack up against these same metrics over time. For a transparent look at some of the platform's best recent results across all users, the Live Trades Scoreboard offers a read-only view of top-performing analyses from the past two weeks, ranked by achieved risk-reward — useful purely as a record of past performance, not a signal source.
As always, past performance is informative, not predictive. Markets can shift quickly, and the strongest edge remains combining data-driven analysis with sound personal risk management. Those new to the platform can explore the Pricing page for trial options, or check the FAQ for common questions about how the AI models and performance tracking work.
Analytical software only. We do not handle funds, make investments, or provide financial advice. Trading involves substantial risk and past performance does not guarantee future results. Always conduct your own research and consider your risk tolerance before making trading decisions.