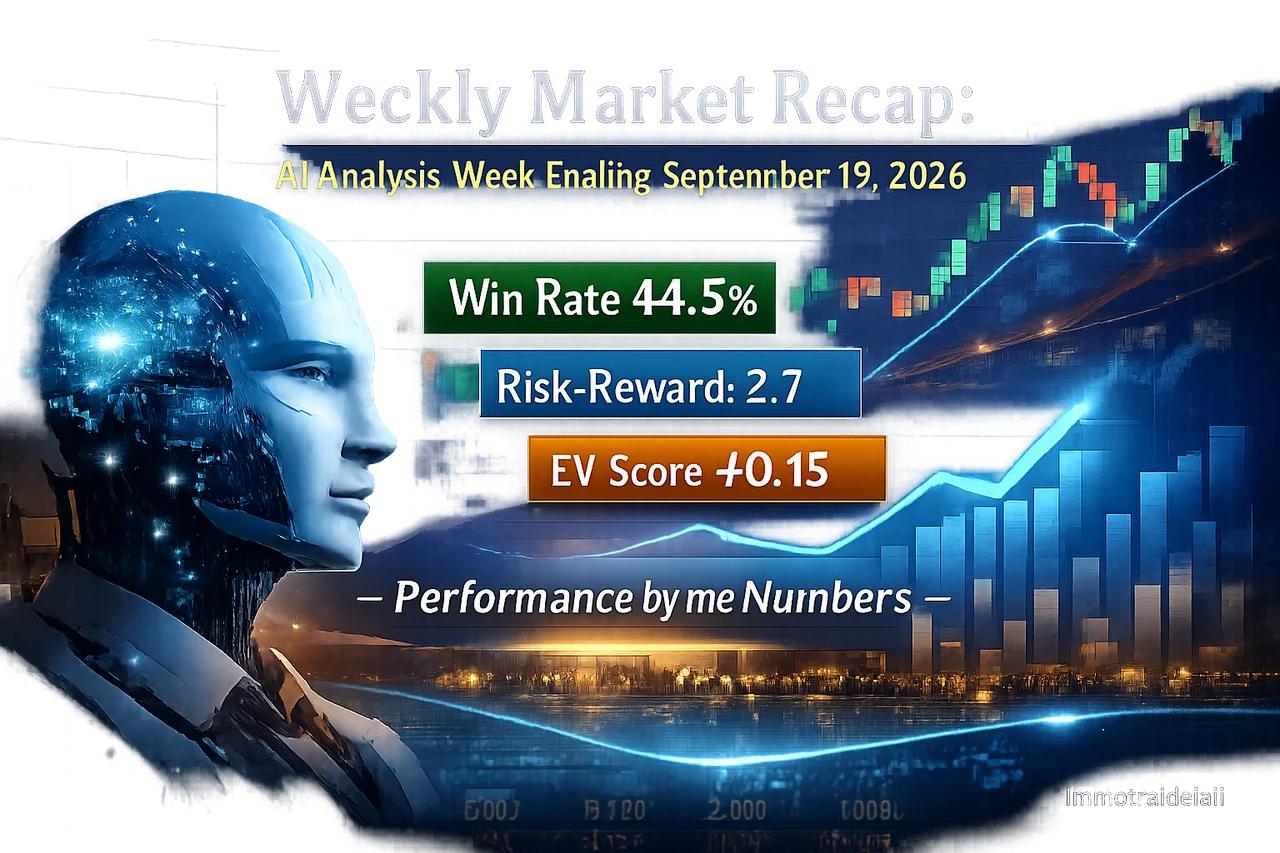
Markets moved through a mixed week of macro data and choppy price action between Saturday, September 13 and Friday, September 18, 2026. Below is a transparent, data-driven breakdown of how the AI's tracked analyses actually performed across that stretch — no cherry-picking, no rounding tricks, just the numbers as they landed each session.
This Week's AI Performance by the Numbers
Averaging the seven daily sessions tracked this week, the platform's analyses produced a blended win rate in the low-to-mid 40% range, with an average risk-reward ratio sitting just above 2.1. The daily EV (expected value) score — which weighs both win rate and RR together rather than judging either in isolation — averaged a modestly positive figure across the week, confirming that even on choppier days, the overall signal quality held a slight statistical edge.
That said, the week was far from uniform. EV scores swung from a low near -0.49 to a high above 1.4 depending on the session, which is a useful reminder that no single day should be read as representative of the strategy's long-term edge. This is exactly why we encourage traders to look at performance over rolling windows rather than isolated sessions — a habit made easier through Trade Tracking, where every user can chart their own analysis history against these broader trends.
Best and Worst Sessions of the Week
Ranked by EV score — the most honest way to compare days, since it accounts for both accuracy and reward size — Monday, September 14 was the standout session of the week. It combined a win rate above 57% with a notably strong average RR near 3.22, producing the week's highest EV reading. Sunday, September 13 followed closely behind with a similarly strong RR profile.
On the other end, Friday, September 18 was the weakest session by EV score, with a win rate around 16.7% despite a respectable average RR of 2.07. It's worth noting that a lower win rate doesn't automatically mean a bad trading day in expectancy terms — RR still matters — but the combination on Friday was enough to pull the day's EV into negative territory. Saturday, September 12 also posted a soft EV reading, reflecting a stretch where fewer setups converted cleanly.
Key takeaway: EV score, not win rate alone, is the metric that actually tells you whether a trading day was statistically good or bad. A 40% win rate with a 3:1 average RR can outperform a 60% win rate with a 1:1 RR — expectancy math doesn't care about which number looks more impressive on its own.
Notable Symbol Activity Over the Past Two Weeks
Looking at the broader two-week window rather than just this week in isolation, a few instruments stood out for both volume and follow-through. AUDJPY was among the most actively analysed pairs recently, with roughly six in ten tracked setups reaching TP1 and a solid share continuing on to TP2 and TP3 — a sign that the pair's recent trending behavior gave the AI's directional calls room to play out.
BTCUSD also saw heavy analysis volume, with just over half of tracked setups reaching TP1 and a meaningful portion pushing further, consistent with crypto's tendency to produce fast, decisive moves once a level breaks. USDCAD and XRPUSD showed more modest but still respectable follow-through, with USDCAD in particular converting close to half of its setups to at least TP1.
XAUUSD told a different story. Gold saw a high volume of tracked setups recently, but the overwhelming majority stopped out before reaching meaningful profit targets, and none progressed all the way to TP3 — a stretch worth watching rather than dismissing outright. Choppy, news-sensitive conditions around gold often produce exactly this pattern: sharp reversals that clip stop-losses before a genuine trend re-establishes itself. It's a good reminder that even a well-reasoned AI analysis can be undone by a market that simply isn't trending cleanly at the time.
The Economic Backdrop
Several scheduled events shaped sentiment during the period, even if most carried low headline importance individually. On the EUR side, ECB President Lagarde's public remarks and the Eurogroup and ECOFIN meetings kept euro-area policy chatter in focus, while German PPI data came in below its prior reading, hinting at continued disinflation pressure in the region. On the USD side, a string of Fed speakers — including FOMC members Schmid and Bowman — alongside Industrial Production and Capacity Utilization releases, added incremental data points without delivering a single decisive catalyst.
None of these events were high-impact in isolation, but collectively they help explain the choppier, lower-conviction sessions seen mid-to-late week, particularly around Thursday and Friday. When markets lack a clear macro trigger, price action tends to chop within ranges — which is precisely the environment where stop-losses get clipped more often, as reflected in Friday's weaker EV reading.
What to Watch Next Week
With no single dominant catalyst on the immediate horizon based on the data available, traders should keep an eye on continuation or reversal signals in AUDJPY and BTCUSD, both of which showed strong recent follow-through and elevated activity. XAUUSD is worth monitoring for a potential shift in behavior — a stretch of stop-outs like the one just seen often precedes either a genuine trend re-establishing or continued range-bound chop, and distinguishing between the two early matters. For traders working shorter timeframes, keeping ScalpHunter notifications active can help catch intraday shifts as they develop rather than after the fact.
Educational Takeaway: Why EV Score Beats Win Rate Alone
This week is a textbook illustration of a lesson every trader eventually has to learn: win rate by itself is a misleading headline number. Monday's session won not because it had the week's highest win rate, but because its RR profile was strong enough to make every winning trade count for more. Friday's session, despite a lower win rate, still carried a healthy average RR — it just wasn't enough to offset the frequency of losses that day.
The practical lesson is to think in terms of expectancy, not accuracy. A strategy that wins less often but captures larger moves when it's right can easily outperform one that wins more frequently but clips small profits. This is the same math that underlies the platform's approach to structuring TP1, TP2, and TP3 levels — each target represents a different point on the risk-reward curve, letting traders scale exposure as a move develops rather than betting everything on a single exit point.
For traders who want to see this principle applied in real time, our Analysis tool generates entries, targets, and stop-loss levels using the same data-driven approach reflected in this recap, and the Live Trades Scoreboard offers a transparent, read-only look at the platform's best verified outcomes over the past two weeks. Newer traders looking to build a stronger foundation in risk-reward thinking can also work through the fundamentals in our Trading Academy.
Analytical software only. We do not handle funds, make investments, or provide financial advice. Trading involves substantial risk and past performance does not guarantee future results. Always conduct your own research and consider your risk tolerance before making trading decisions.