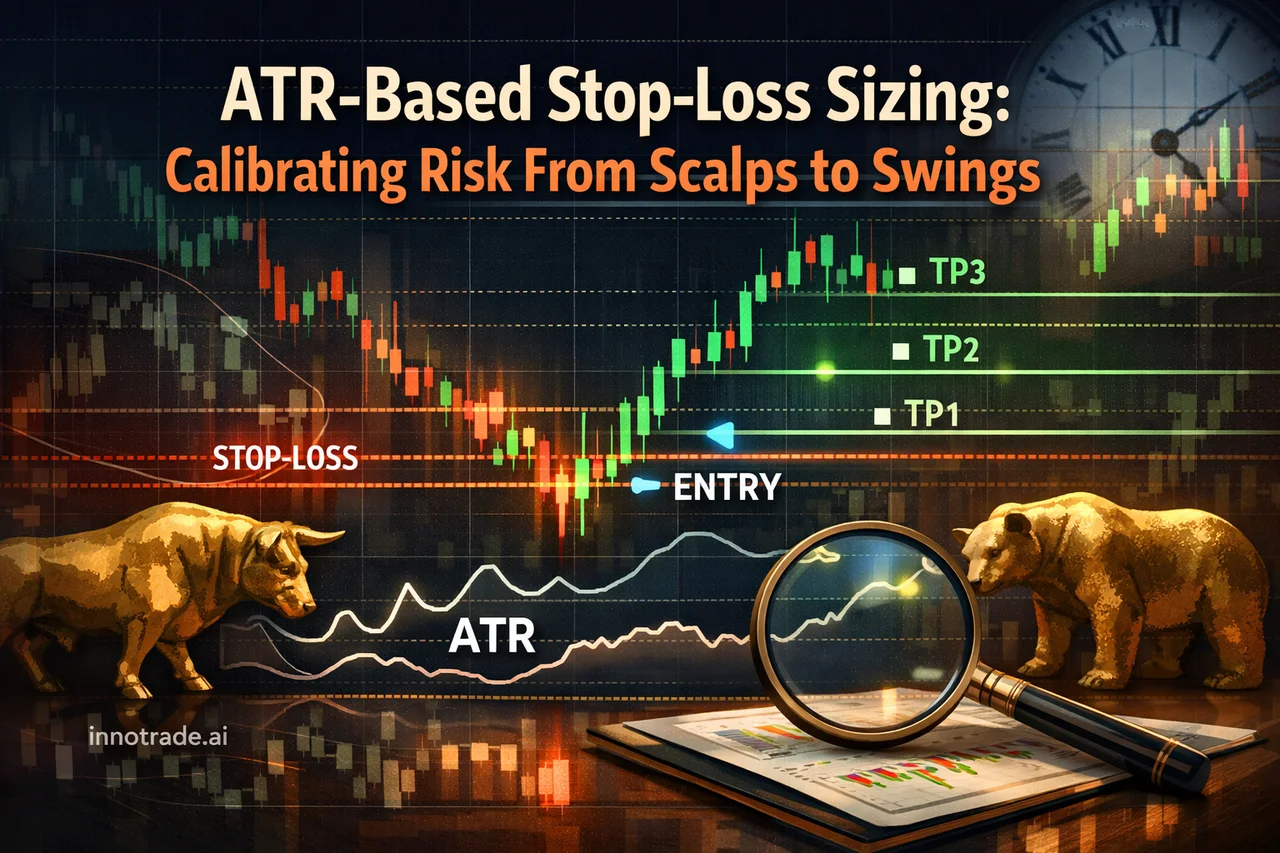
Ask ten traders how far their stop-loss should sit from entry, and you'll likely get ten different answers based on habit rather than logic. A 15-pip stop might be reasonable on a quiet EUR/USD range but reckless on a volatile XAU/USD breakout session. The fix isn't a bigger or smaller fixed number — it's sizing your stop-loss to actual market volatility, and then managing that stop dynamically as price moves through TP1, TP2, and TP3.
This guide breaks down how to calibrate stop-loss distance using volatility (commonly measured via ATR — Average True Range), how that changes across scalping, day trading, and swing strategies, and how to structure your exit management once an AI-generated analysis entry starts working in your favor.
Why a Fixed Stop-Loss Distance Doesn't Work Across Strategies
The core problem with fixed-pip or fixed-dollar stops is that they ignore what the market is actually doing right now. A 10-pip stop on GBP/USD during the London-New York overlap gets clipped by normal noise. The same 10-pip stop during an Asian-session lull might be needlessly wide relative to the setup's actual risk. Volatility isn't constant, so your stop distance shouldn't be either.
This matters even more when trading instruments with wider natural spreads or gaps — certain JPY crosses, metals, and crypto pairs can move several times the average forex pair's range in a single hour. A stop-loss sized for EUR/USD, applied blindly to XAU/USD or BTC/USD, will either get stopped out prematurely or expose far more risk than intended.
Sizing Stops With ATR: A Practical Framework
ATR measures the average range a market covers over a given number of candles, giving you a volatility-adjusted way to place stops. In practice:
- Scalping (1-5 minute charts): Stops are typically placed at a fraction of the ATR on the working timeframe — tight enough to protect capital on quick in-and-out trades, but wide enough to survive normal wick noise. On XAU/USD scalps specifically, where a single 5-minute candle can easily swing several dollars, sizing the stop purely on ATR rather than a fixed dollar amount prevents both premature stop-outs and oversized risk during volatile sessions.
- Day trading: Stops are usually anchored below (or above, for shorts) recent swing low/high structure, then cross-checked against ATR to confirm the distance is proportional to the day's actual movement — not just a technical level that happens to look clean on the chart.
- Swing trading: Stops sit further out, often beyond a multi-day structural level, with ATR used to confirm the position size is adjusted so the wider stop doesn't translate into oversized dollar risk.
For index futures scalpers, the same logic applies at the tick level — the stop distance in ticks should reflect the instrument's typical intraday range, not an arbitrary round number of ticks that ignores current volatility.
Structuring the Trade: Entry, TP Levels, and Stop Management
Every AI-generated analysis on the platform is built around a defined entry point, three take-profit levels (TP1, TP2, TP3), and a stop-loss. Conceptually, these three TP levels represent scaling exit points rather than a single all-or-nothing target:
- TP1 is typically the first reasonable resistance/support reflex — a level many traders use to lock in partial profit and reduce risk.
- TP2 extends further, capturing continuation once the first reaction has been absorbed.
- TP3 is the extended target, often aligned with a higher-timeframe structural zone — for swing trades, this is frequently a daily resistance or support zone rather than an intraday level.
Because each level is progressively harder to reach, it's natural and expected that fewer trades reach TP3 than TP1 — that's not a flaw in the setup, it's simply how scaled exits work.
A common and disciplined way to manage the stop-loss through this sequence:
- Once TP1 is hit, move the stop-loss to breakeven. This removes downside risk on the remaining position entirely.
- Once TP2 is hit, consider trailing the stop behind recent structure (for swing trades) or a shorter moving average (for day trades), locking in additional gains while leaving room for TP3 to play out.
- For multi-timeframe swing setups, staggering TPs against both the entry timeframe and the daily chart helps avoid exiting too early relative to the broader trend.
Applying This Across Strategies
On GBP/USD day trades, TP1/TP2/TP3 spacing needs to reflect the pair's typical daily range — targets set too close together burn through all three levels in minutes, while targets spaced too far apart on a slow day may never be reached. On crypto swing trades (BTC/USD, ETH/USD, SOL/USD), confirmation of the AI entry signal against a higher timeframe trend line adds an extra layer of conviction before committing to a multi-day hold, given how sharply sentiment can shift in that market.
What Recent Data Shows
Looking at the past week of tracked daily performance across the platform, the aggregated win rate averaged roughly 61.3%, with an average risk-reward ratio near 2.13 — a reasonable range for a mix of scalping, day, and swing setups managed through staggered TP exits. Within that week, Wednesday, August 12 stood out as the strongest session by EV score, posting a 66.7% win rate at a 3.20 average RR, while Thursday, August 13 was the weakest stretch, with EV score dropping to -0.70 amid a lower win rate and tighter average RR — a reminder that even a sound stop-loss framework won't win every day, and consistency should be measured over a stretch of sessions rather than any single one.
Zooming out, across all tracked trades on the platform, the all-time win rate has held around 53.9% with an average RR near 2.02 — context that reinforces why disciplined stop-loss sizing and staged exits matter more than chasing any single big win.
Instruments like XAU/USD have seen consistently high trade volume recently, with solid follow-through into TP1 and TP2 relative to stop-loss hits — a useful reminder that volatility-adjusted stops paired with staged exits tend to perform better on instruments with wider natural ranges than tight fixed-pip stops ever could.
Actionable Takeaway
Stop-loss placement isn't a one-size-fits-all number — it should scale with the volatility of the instrument and timeframe you're trading. Use ATR (or an equivalent volatility measure) to size your initial stop, structure formations like swing lows/highs for day trades, and daily resistance/support zones for swing TP3 targets. Then manage the trade actively: breakeven after TP1, trailing after TP2, and letting TP3 play out on the broader structure. Review your own execution of this process regularly in Trade Tracking to see how your stop-loss discipline is actually performing over time, and browse verified historical results on the Live Trades Scoreboard for transparency on how top-performing setups have played out. If you're still building these habits, the Trading Academy covers the fundamentals of risk management in more depth, and the Pricing page outlines how to get started with a free trial.
Analytical software only. We do not handle funds, make investments, or provide financial advice. Trading involves substantial risk and past performance does not guarantee future results. Always conduct your own research and consider your risk tolerance before making trading decisions.