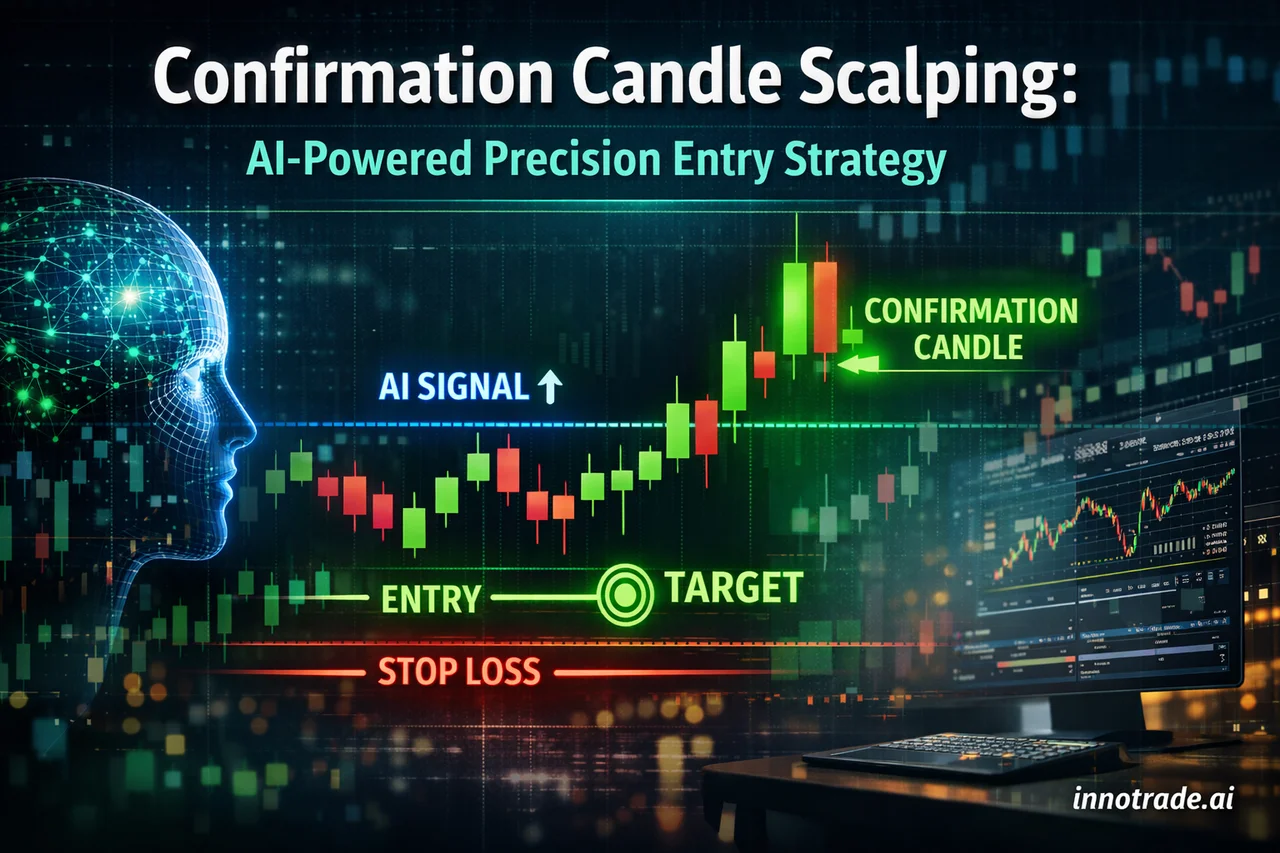
One of the most common mistakes retail traders make isn't picking the wrong direction — it's entering the moment a signal appears instead of waiting for the market to confirm it. The confirmation candle method solves this by adding a single, simple filter on top of any AI-generated analysis: wait for one candle to close in your favor before committing capital. This guide walks through how to apply that filter across scalping, day trading, and swing trading, with stop-loss sizing, timeframe selection, and exit management built in.
The Confirmation Candle Method: Why Waiting One Candle Changes Everything
An AI-generated entry point marks the level where the model expects favorable risk-reward — but price doesn't always move in a straight line to get there. A confirmation candle is the next candle (on whatever timeframe you're trading) that closes in the direction of the signal, ideally with a body that pushes through the suggested entry zone rather than just wicking into it. Instead of entering the instant an AI analysis is published, you wait for that candle to close. This single habit filters out a meaningful share of false starts, particularly around news releases or session opens where volatility spikes and reverses quickly.
Building the One-Minute Scalping Setup with AI Confirmation
For scalpers working the 1-minute chart, the confirmation candle approach pairs naturally with ScalpHunter signals. When a scalping opportunity appears with a 4/5 or 5/5 confidence rating, resist the urge to market-order immediately. Instead, watch the very next 1-minute candle. If it closes in the signal's direction with a real body (not just a thin doji), that's your green light. If it closes against the signal or produces an indecisive doji, stand aside — the setup likely needs more time to develop or was a false trigger. This costs you a few seconds of favorable price movement in exchange for meaningfully better entry quality, which matters enormously on 1-minute timeframes where spread and slippage eat into thin scalping margins.
Sizing Your Stop-Loss for EUR/USD Scalping Sessions
Stop-loss sizing on EUR/USD scalps should be a function of session volatility, not a fixed pip count. During the London-New York overlap, average true range on the 1-minute chart is typically wider than during the Asian session, so a stop that's appropriate at 3am London time may be far too tight during peak liquidity hours. A practical rule: measure the current ATR on your entry timeframe and place your stop at roughly 1 to 1.5 times that value beyond the confirmation candle's low (for longs) or high (for shorts). This keeps your stop tethered to actual market noise rather than an arbitrary number, and it's exactly the logic built into the stop-loss placement on every AI-generated analysis on the platform — the stop isn't static, it's contextual to the pair and the moment.
Best Timeframe for AI Scalping on Gold
Gold (XAU/USD) behaves differently from EUR/USD — it trends harder intraday and reacts sharply to real yields and dollar strength. Pure 1-minute scalping on gold can be brutal because of how quickly spreads widen during volatility spikes. A 5-minute chart tends to strike a better balance: it's still fast enough to scalp multiple setups per session, but it filters out enough of the 1-minute noise that confirmation candles are more reliable. If you're using AI analysis for gold specifically, treat the 5-minute close as your confirmation trigger rather than the 1-minute close, and expect wider ATR-based stops than you'd use on majors.
Filtering Out Choppy, Sideways Markets
No confirmation method works well in a market that's simply going nowhere. Before taking any scalp, check whether price has been oscillating in a tight, directionless range for the prior 20-30 candles. If so, treat any AI signal in that window with extra skepticism, or skip it entirely — confirmation candles get whipsawed constantly in chop because there's no real directional conviction behind any single close. The platform's own tracked performance reflects this reality: not every session is a strong one, and that's expected. Over the past week, tracked win rates ranged from a standout session in the mid-80% range down to a quieter day near 50% on lighter volume — a reminder that filtering for trend conditions, not just signal presence, is part of disciplined execution.
Adding RSI Divergence as a Secondary Confirmation Layer
For traders who want an extra layer of conviction before entering, RSI divergence is a useful companion to AI-generated entries. If the AI signal calls for a long and price is simultaneously printing a higher low while RSI prints a lower low (bullish divergence), that's two independent signals agreeing on exhaustion of the prior move. This doesn't need to be a rigid requirement for every trade, but when it lines up with a confirmation candle and an AI entry zone, it's often worth increasing conviction — and potentially position size within your normal risk parameters.
From Scalping to Swing: Extending the Method Across Timeframes
The same confirmation logic scales up. Day traders looking for reversal setups can wait for a 15-minute confirmation candle after an AI signal flags a potential turn, placing the stop just beyond the rejection wick rather than an arbitrary distance away. Swing traders can apply it to breakout-retest situations: after a breakout, wait for price to pull back toward the broken level, then use a 15-minute confirmation candle closing back in the breakout direction as the actual entry trigger — this typically produces a tighter stop and better risk-reward than chasing the initial breakout candle.
Exit management follows the same principle across all three styles. Rather than closing an entire position at TP1, consider scaling out — take a portion of the position off at TP1 to lock in progress, trim more at TP2, and let a smaller runner ride toward TP3. Take-profit spacing itself is often built around ATR multiples: TP1 near 1x ATR, TP2 near 2x ATR, TP3 further out, which naturally explains why TP1 gets hit more often than TP3 — it's simply closer. For swing positions, expect holding periods to run from several days to a couple of weeks depending on the instrument and volatility, and use the Trade Tracking dashboard to monitor how each position is progressing relative to its original targets.
What the Data Says About Confirmation-Based Entries
Looking at the platform's tracked performance over the past week, the average win rate across daily sessions sat around 67.7%, with an average risk-reward ratio near 2.11 and an average EV score just above 1.1 — a healthy sign of positive expected value across varying market conditions. The strongest session of the week, Thursday, July 16, combined a high win rate with solid RR for the best EV score of the period, while Tuesday, July 14 was the softest stretch on lighter volume. Across all tracked trades historically, the platform has maintained an all-time win rate of 54.3% with an average RR of 2.00 — context that underscores why disciplined entry filtering, not just signal presence, is what separates consistent execution from chasing every alert.
Key Takeaways
- Wait for a confirmation candle close before acting on any AI signal — it filters false starts, especially in volatile sessions.
- Size EUR/USD scalping stops using ATR, not fixed pip counts, since volatility shifts meaningfully by session.
- Shift gold scalping to the 5-minute chart for more reliable confirmation and fewer spread-driven stop-outs.
- Skip or reduce size on signals appearing inside tight, choppy ranges.
- Layer RSI divergence onto AI entries for added conviction rather than as a strict requirement.
- Scale out at TP1/TP2 and let a runner target TP3, spacing targets using ATR multiples.
For traders who want to see this framework applied live, the Features page details how entries, stops, and multi-level targets are structured across every instrument, and the Trading Academy covers the underlying risk management concepts in more depth. If you'd like to test the confirmation-candle approach on your own trades, a 7-day free trial gives you room to practice it before committing further.
Analytical software only. We do not handle funds, make investments, or provide financial advice. Trading involves substantial risk and past performance does not guarantee future results. Always conduct your own research and consider your risk tolerance before making trading decisions.