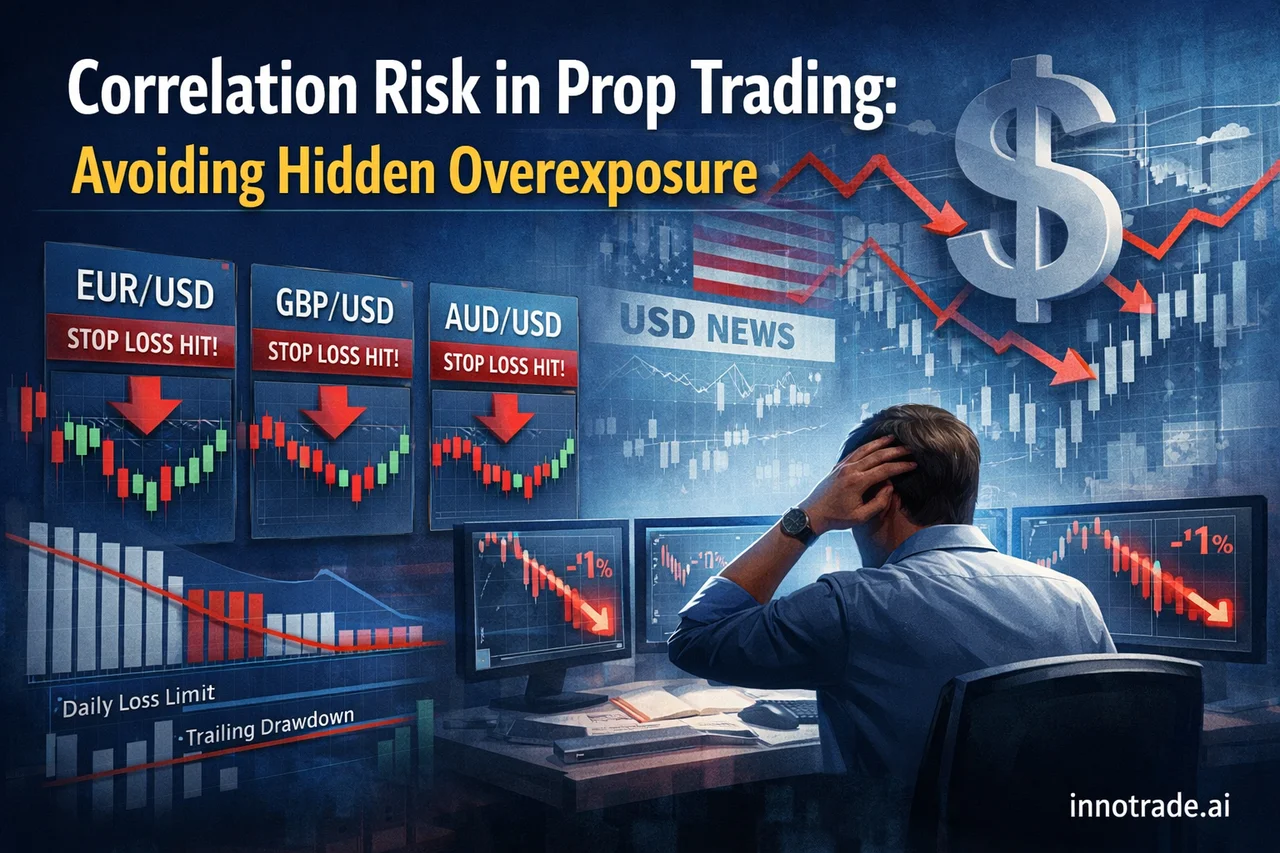
Most prop firm challenge failures don't come from one bad trade. They come from several trades that were never really independent in the first place. A trader opens positions on EUR/USD, GBP/USD, and AUD/USD simultaneously, feels diversified, and then watches all three hit stop-loss within minutes of a single USD-driving news release. On paper it looked like three separate 1% risk trades. In reality, it was one 3% bet on the dollar — and that's exactly the kind of hidden overexposure that trips up funded traders against daily loss limits and trailing drawdown rules.
This is correlation risk, and it's one of the least discussed but most consequential concepts in prop firm trading. Unlike position sizing or stop-loss placement, it doesn't show up clearly on a single trade ticket — it only becomes visible when you look at your entire open exposure at once.
What correlation risk actually looks like in a challenge
Correlation risk happens when multiple positions are exposed to the same underlying driver, even though they appear to be different instruments. Classic examples include:
- Trading AUD/JPY and USD/CAD at the same time during a risk-off move — both often move with broader risk sentiment and commodity currency flows.
- Holding XAU/USD and XAG/USD longs together — both are precious metals that typically respond to the same real-yield and dollar-strength drivers.
- Taking multiple JPY pairs (EUR/JPY, USD/JPY, AUD/JPY) around a Bank of Japan-related release like the Monetary Policy Meeting Minutes or Average Cash Earnings data — a single JPY shock moves all three at once.
- Holding NZD/USD alongside AUD/USD ahead of high-impact New Zealand data such as the Employment Change or Unemployment Rate figures, where a surprise print can move the entire commodity-bloc basket in the same direction.
None of these are wrong trades individually. The problem is when a trader treats them as separate risk units instead of recognizing that a single macro shock could hit all of them simultaneously — turning a modest, well-planned risk budget into a single oversized bet against one theme.
Why this matters more in a funded account than a personal one
In a personal account, correlated losses just hurt. In a prop firm challenge or funded account, they can end the account entirely, because most firms enforce hard daily loss limits and maximum drawdown thresholds that don't care why several trades lost together — only that they did. A trader who risks 1% on five correlated pairs hasn't spread risk five ways; they've concentrated it, and a single adverse move can burn through a daily loss limit in one sitting.
This is precisely where a disciplined, data-driven view of the market — rather than instinct — becomes valuable during an evaluation.
How AI-assisted analysis helps surface correlation blind spots
One underrated benefit of running AI analysis across multiple instruments side by side is that it forces a trader to look at the whole board, not just the pair in front of them. When entries, TP levels, and stop-loss placement are generated independently for each instrument based on that instrument's own structure and volatility, it becomes far easier to notice when three separate signals are actually leaning on the same directional theme.
Looking at recent tracked performance across instruments illustrates the point. Over the past two weeks, AUD/JPY setups have shown solid TP1 follow-through with a meaningful share progressing to TP2 and a smaller portion reaching TP3 — a fairly typical decay pattern. XAU/USD, the most heavily analyzed instrument in that window, showed a similar shape: a healthy majority of tracked setups reaching TP1, roughly a quarter continuing to TP2, and single-digit percentages pushing all the way to TP3. BTC/USD followed a comparable curve, with USD/CAD showing steady but more modest TP1 conversion. XRP/USD, by contrast, produced a flatter distribution across all three levels — a reminder that not every instrument behaves the same way even within the same analysis framework, and that treating two crypto assets as automatically correlated is its own kind of mistake.
The point isn't that any single symbol is guaranteed to perform a certain way — it's that seeing these patterns laid out side by side, instrument by instrument, makes it easier to ask the right question before stacking positions: am I actually diversifying, or am I just repeating the same bet in a different wrapper?
What the past week's data shows about consistency
Consistency, not one spectacular day, is what prop firms are actually testing for — and it's also the more useful lens for evaluating any trading approach, including AI-assisted analysis. Looking at the last seven tracked trading days, the average win rate across the period sat close to 46%, with an average risk-reward ratio a little above 2.1. That's a meaningfully different picture than looking at any single day in isolation.
For instance, the EV-strongest session of the week landed on Saturday, August 1, where a smaller number of tracked trades produced a win rate of 50.0% at an average RR of 3.60 — a combination that pushed EV score well above the week's average. Compare that to Sunday, August 2, the weakest session by EV score, where a thinner batch of trades produced a 20.0% win rate at a 1.83 average RR. The lesson isn't that Saturday was flawless or Sunday was broken — it's that EV score, which blends win rate and reward together, is a far more honest way to judge a session than win rate alone. A day with a lower win rate but strong RR can still be net-positive, and that's exactly the kind of nuance prop firm traders need to internalize when managing a challenge under a fixed loss budget.
Building a correlation-aware framework for your challenge
A few practical habits go a long way toward avoiding correlation-driven blowups:
- Group your open positions by driver, not by ticker. Before adding a new trade, ask what macro theme it shares with positions you already hold.
- Treat your daily loss limit as a portfolio constraint, not a per-trade one. If three correlated trades could plausibly lose together, size each one as if it were part of a single combined position.
- Watch the economic calendar for shared exposure events. A high-importance release like the NZD Employment Change or Unemployment Rate can move every NZD and AUD pair you hold at once — plan around that before it happens, not after.
- Use your own trade history, not just gut feel. Reviewing performance across strategies and instruments on Trade Tracking makes it easier to spot when losses are clustering around a common theme.
- Remember that TP1, TP2, and TP3 represent progressively harder targets to reach. Scaling out at TP1 on multiple correlated instruments doesn't remove correlation risk on the remaining runners — it just delays the reckoning.
None of this eliminates market risk — no framework does, and any trader claiming otherwise isn't being honest with you. What it does is reduce the odds that a single macro surprise turns into an account-ending day during a challenge. For traders who want to build this kind of discipline from the ground up, the Trading Academy covers the fundamentals of risk management in more depth, and the FAQ addresses common questions about how AI-generated analysis fits into a broader trading process. For transparency on how tracked analyses have actually performed over time, the Live Trades Scoreboard displays the platform's best recent results as a public record — not a signal to act on, simply proof of past performance.
The takeaway for anyone attempting a prop firm challenge: count your real exposure, not your trade count. Five positions with one shared driver is one risk, dressed up as five.
Analytical software only. We do not handle funds, make investments, or provide financial advice. Trading involves substantial risk and past performance does not guarantee future results. Always conduct your own research and consider your risk tolerance before making trading decisions.