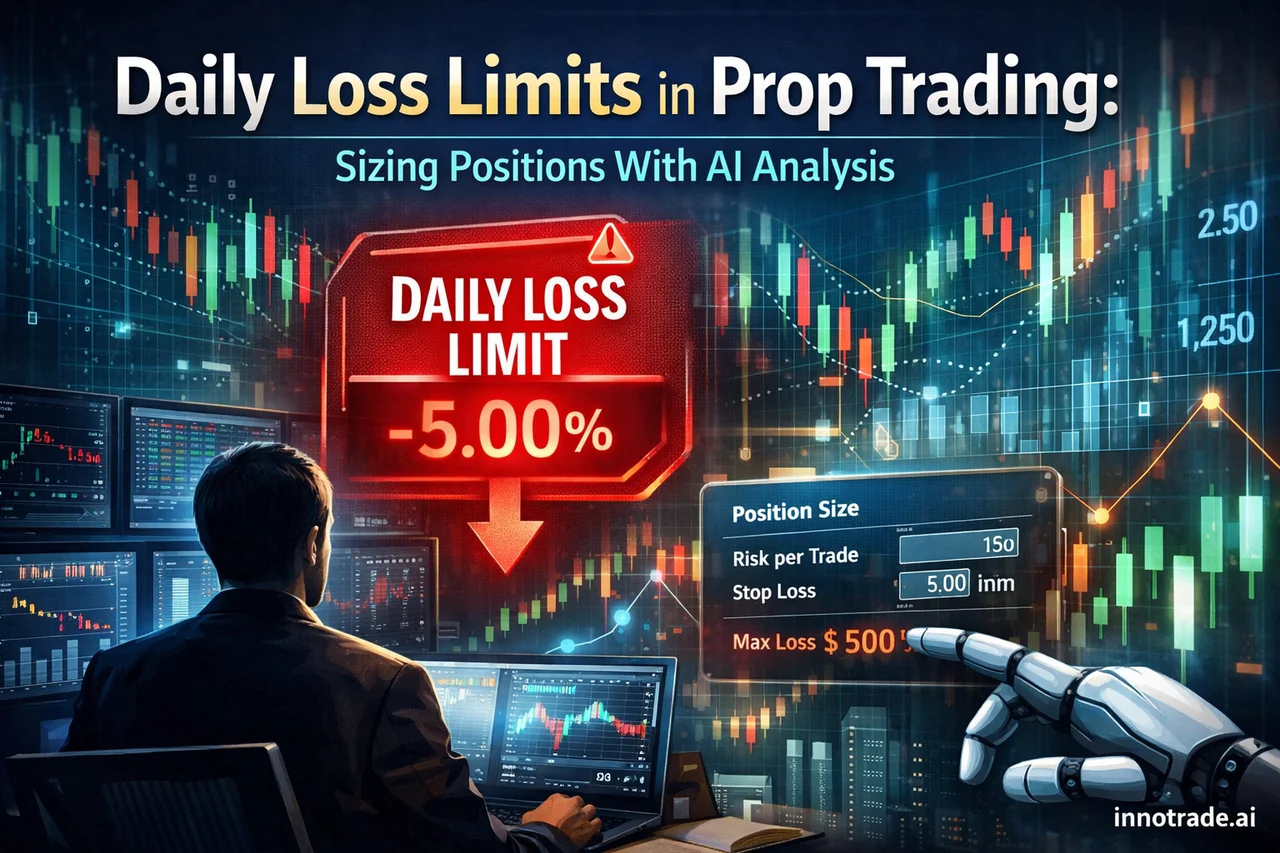
Most traders preparing for a prop firm evaluation obsess over the overall drawdown limit — the 8% or 10% ceiling that ends the challenge if breached. Fewer pay enough attention to the rule that actually trips people up first: the daily loss limit. Unlike max drawdown, which accumulates over the life of the account, a daily loss limit resets every 24 hours and punishes a single bad session regardless of how well the week is going overall. Understanding how to size positions around this specific rule — rather than around drawdown in general — is one of the most underrated skills in funded trading.
Why Daily Loss Limits Are Different From Max Drawdown
Max drawdown is a marathon constraint. Daily loss limits are a sprint constraint. A trader can be comfortably within their overall drawdown allowance and still fail an evaluation because they lost 6% in a single session against a 5% daily cap. This matters because the psychological pressure of a daily limit encourages exactly the wrong behavior: revenge trading after an early loss, oversizing to "make it back" before the daily reset, or abandoning a sound strategy mid-session because the account is close to the line.
The fix isn't a mindset trick — it's structural. Position sizing needs to be calculated with the daily limit as the binding constraint, not the overall drawdown figure, and that means knowing your realistic loss-per-trade probability in advance rather than discovering it live.
Where AI-Assisted Analysis Fits Into Daily Risk Budgeting
This is where consistent, data-backed analysis earns its keep. Instead of sizing trades on gut feel, traders using AI-powered analysis can reference a defined stop-loss and risk-reward structure for every setup before it's taken, which makes it possible to calculate — before the session starts — how many losing trades in a row the account can absorb before touching the daily limit. If a firm allows a 5% daily loss and each analysis risks 0.5% of account equity, that's a mathematically defined ceiling of ten consecutive stop-outs, not a vague sense of "I should be careful today."
The key is that this only works if the risk-reward data behind each setup is actually reliable over time, not just plausible-sounding. That's why tracking real performance matters more than tracking a single trade idea.
What Recent Data Shows About Consistency
Looking at the past week of tracked analyses across the platform, the average win rate landed around 52.4% with an average risk-reward ratio near 2.07 and an average daily EV score of roughly 0.61 — a composite measure that weighs both win rate and reward size rather than either in isolation. That EV framing matters for daily loss limit planning specifically, because a day can have a mediocre win rate and still be a net-positive session if the reward-to-risk on winners is strong enough, or a strong win rate and still be a weak session if reward sizing was poor.
The week wasn't uniform. The strongest session by EV score was Friday, August 21, which closed with a 57.1% win rate and a 2.49 average RR — a combination that produced the week's highest EV reading. The weakest session, by contrast, was Saturday, August 22, with a 28.6% win rate and a 1.18 average RR, dragging the day's EV score into negative territory. That single weak day is a useful reminder for daily loss limit planning: even a platform with a positive long-term edge will have sessions that lose money, and a trader's sizing has to be built to survive those sessions, not just the good ones.
A daily loss limit isn't a punishment for bad trading — it's a structural reminder that no single day should be able to end your evaluation. Size for the weak days, not the strong ones.
Applying TP Structure to Daily Risk Planning
Many AI-generated setups on the platform include three take-profit levels — TP1, TP2, and TP3 — with win rates that naturally decline from TP1 to TP3, since each successive level requires price to travel further in the trader's favor. For daily loss limit purposes, this staged structure is useful: scaling out partial size at TP1 locks in progress toward the daily target early, reducing the odds that a reversal turns a winning session into a break-even or negative one before the daily reset. Traders who bank partial profits at TP1 while letting a smaller position run toward TP2 or TP3 tend to have smoother daily equity curves — which is exactly what daily loss limit compliance rewards.
Instrument Selection Also Matters
Not all instruments behave the same way under daily risk constraints. Over the past two weeks, pairs like USDCAD have shown notably strong follow-through toward deeper TP levels relative to their stop-loss hits, while more volatile instruments such as BTCUSD and AUDJPY have shown a higher proportion of stop-outs. For a trader operating under a tight daily loss limit, leaning slightly more on setups in steadier instruments during the evaluation phase — and treating higher-volatility symbols with smaller size — can reduce the odds of a single volatile session breaching the daily cap.
Turning This Into a Repeatable Process
The practical takeaway is simple: calculate your daily loss limit in account currency terms, divide it by your per-trade risk, and treat that number as your maximum consecutive-loss tolerance for the day — then stop, regardless of conviction, once it's reached. Reviewing your own historical hit rates and RR outcomes on a dashboard like Trade Tracking makes this calculation grounded in your actual results rather than assumptions, and the platform's Live Trades Scoreboard offers transparent, verifiable proof of past performance for anyone evaluating whether this kind of data-driven approach is worth building a process around.
Daily loss limits aren't designed to be unfair — they're designed to catch exactly the kind of oversized, emotional trading that ends most challenges. Traders who plan their position sizing around the daily cap specifically, rather than the overall drawdown figure, tend to survive far more evaluation attempts. If you're still building this habit, the Trading Academy covers risk management fundamentals in more depth, and the Features page outlines how the platform's analysis structure supports this kind of disciplined sizing.
Analytical software only. We do not handle funds, make investments, or provide financial advice. Trading involves substantial risk and past performance does not guarantee future results. Always conduct your own research and consider your risk tolerance before making trading decisions.