Every trader eventually hits a losing streak. What separates traders who recover from those who blow up their accounts isn't luck — it's whether they understand the math of drawdown recovery before the losses happen. The relationship between how much you lose and how much you need to gain back is not linear, and misunderstanding this asymmetry is one of the most common — and most expensive — mistakes in retail trading.
The Asymmetry Nobody Warns You About
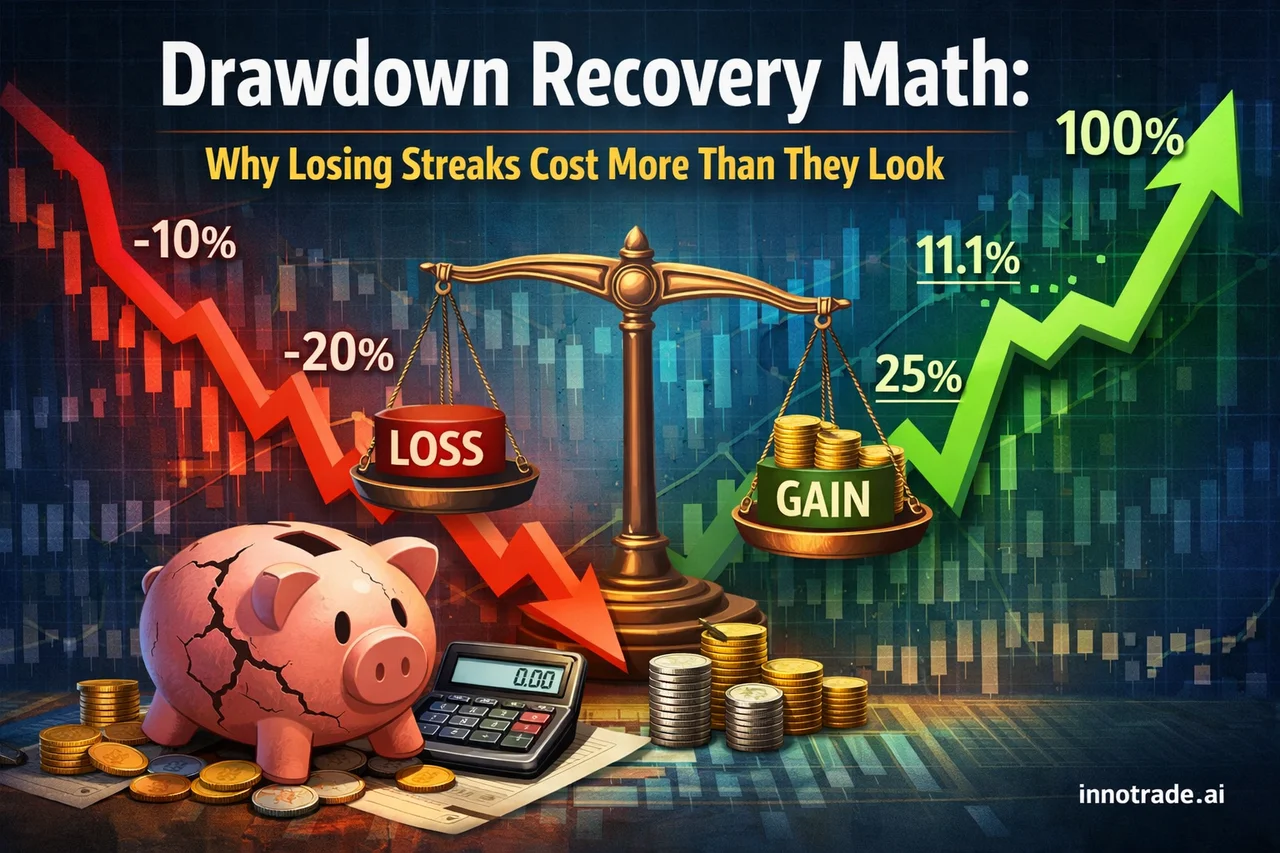
Say your account drops 10%. To get back to breakeven, you don't need a 10% gain — you need roughly 11.1%. Drop 20%, and you need a 25% gain. Drop 50%, and you need to double your remaining capital just to get back to where you started. This is drawdown recovery math, and it's brutally unforgiving because each loss shrinks the base you're compounding from.
- 10% drawdown → requires ~11.1% gain to recover
- 20% drawdown → requires ~25% gain to recover
- 30% drawdown → requires ~42.9% gain to recover
- 50% drawdown → requires a full 100% gain to recover
The curve doesn't rise gently — it accelerates. This is exactly why professional risk management obsesses over limiting the depth of a drawdown rather than trying to trade harder to escape one. Once you're down 40-50%, the math turns recovery into a near heroic feat, and most traders who try end up taking on far more risk than they should, digging the hole deeper instead of climbing out.
Why Losing Streaks Feel Worse Than They Are — and Sometimes Better
Losing streaks are a statistical certainty in any strategy with a win rate below 100%, including AI-assisted analysis. A string of stop-losses in a row doesn't necessarily mean an edge has broken down — it can simply be variance playing out. This is where looking at aggregated data over time, rather than reacting to any single session, matters.
Take our own tracked data from the past week. Aggregated across the daily sessions, the average win rate sat around 45.1% with an average risk-reward ratio near 2.27 — figures that reflect a mix of stronger and weaker days rather than one smooth curve. The weakest session of the period, Sunday, August 2, saw win rate slip to 20.0% with an average RR of 1.83, producing a negative expected value (EV) score of -0.43 for that day alone. Judged in isolation, that day looks alarming. But by the very next stretch, momentum shifted — Saturday, August 1 stood out as the strongest session of the period, posting an EV score of 1.30 on a healthy average RR of 3.60. That's the nature of variance: a rough day is rarely the full story, and reacting emotionally to it — rather than to the weekly trend — is how traders turn a manageable dip into an unnecessary drawdown.
This is also why we rank days by EV score rather than win rate or RR alone on our Trade Tracking dashboard. EV score blends both hit rate and payout size into a single honest measure of whether a stretch of trading actually added value — a single low win-rate day can still carry a positive EV score if the RR on winners was strong enough, and vice versa.
Where AI Confidence Scores Fit In
One of the more practical tools for managing drawdown risk before it happens is paying attention to signal confidence rather than treating every setup identically. On ScalpHunter, for example, each scalping opportunity is tagged with a confidence level from 1 to 5. This isn't a guarantee of outcome — no confidence score can promise a winning trade — but it's a way of quantifying how strongly current price action, volatility, and structure align with the model's criteria at that moment.
Used correctly, an AI confidence score becomes a position-sizing input, not a green light to trade blindly. A trader might allocate standard risk to a 4/5 or 5/5 confidence setup and scale down meaningfully on a 2/5 or 3/5, effectively pre-emptively limiting how deep any single losing streak can cut. This is the same logic institutional risk desks use with conviction-weighted sizing — the AI confidence score just makes that conviction explicit and numerical instead of gut-feel.
The goal isn't to avoid losing streaks entirely — that's not realistic in any strategy. The goal is to make sure no single streak, or single trade, can put you in a drawdown deep enough that recovery math turns against you.
Practical Rules to Blunt Drawdown Depth
- Risk a fixed, small percentage per trade (commonly 0.5–2%) so that even five or six consecutive losses don't meaningfully impair your capital base.
- Size down on lower-confidence setups rather than treating every signal — AI-generated or otherwise — as equal conviction.
- Judge performance over a rolling week, not a single session. One weak day with a negative EV score inside an otherwise solid week is normal variance, not a broken edge.
- Track your own drawdown curve, not just your win rate. A high win rate with occasional large losses can still produce a nasty drawdown; a lower win rate with disciplined RR can be far gentler on your equity curve.
Across all tracked activity on the platform, the all-time win rate has held near 53.9% with an average RR around 2.01 — context that shows a modest edge sustained over time rather than dramatic short-term swings. That kind of steady profile is exactly what keeps drawdowns shallow enough to recover from without needing outsized, desperate gains. You can review the mechanics behind verified performance figures, including third-party sync with Myfxbook, in our FAQ, and see how top-performing, publicly tracked setups have played out on the Live Trades Scoreboard — a transparency page, not a signal source.
The Takeaway
Drawdown recovery math is simple arithmetic, but its implications are the foundation of survivable trading. Protecting the depth of a drawdown matters more than chasing the next winning trade to escape one. Pairing disciplined position sizing with confidence-weighted signal filtering — the kind available through tools like ScalpHunter — and monitoring your own equity curve on Trade Tracking gives you the structure to keep losing streaks as minor dips rather than account-threatening events. If you're still building these habits, our Trading Academy covers the risk management fundamentals that make this math work in your favor over time.
Analytical software only. We do not handle funds, make investments, or provide financial advice. Trading involves substantial risk and past performance does not guarantee future results. Always conduct your own research and consider your risk tolerance before making trading decisions.