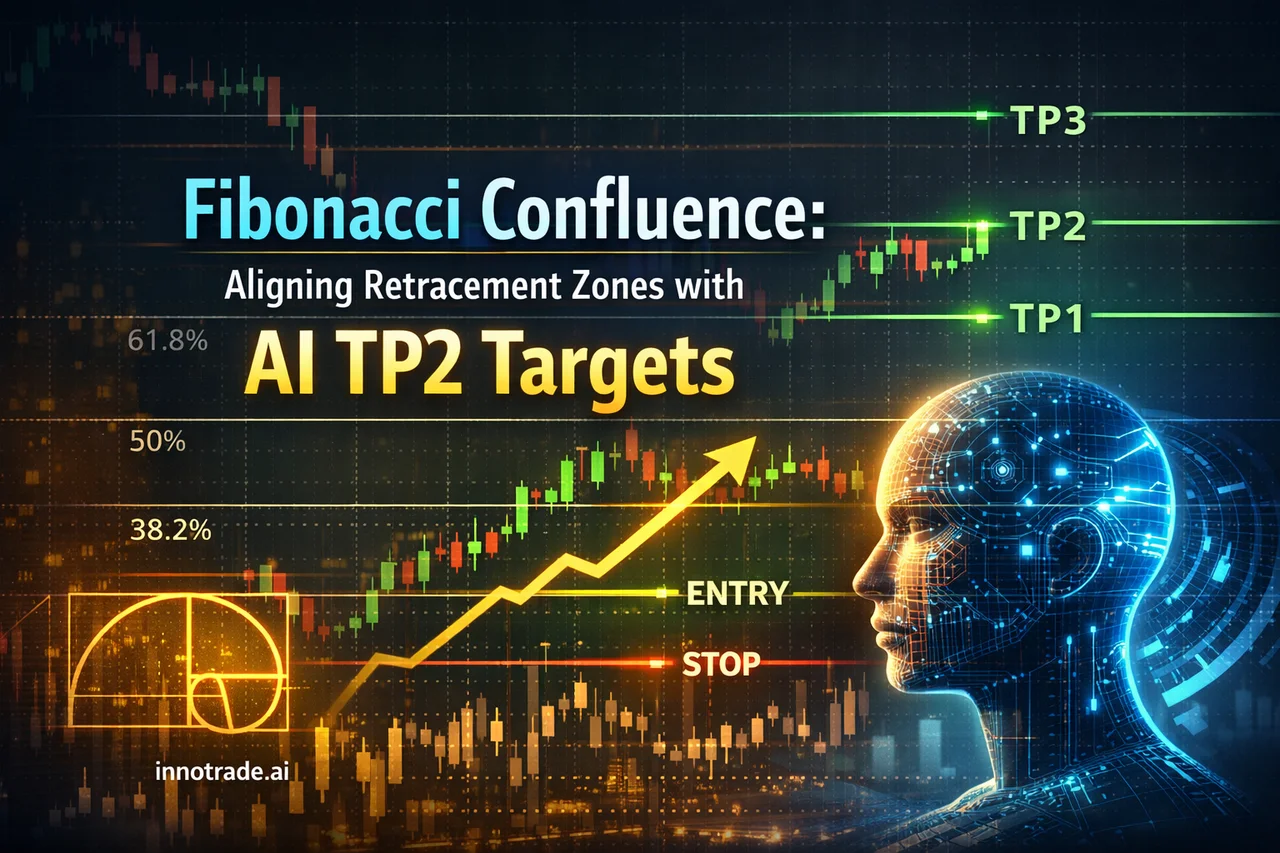
Technical confluence — the practice of stacking multiple independent signals over the same price zone — is one of the oldest concepts in trading, yet most traders still apply it manually, eyeballing Fibonacci retracements against support and resistance without a structured framework. This guide shows a more systematic approach: aligning classic Fibonacci retracement zones with the entry, TP1/TP2/TP3, and stop-loss structure generated by AI analysis, and adapting the combination across scalping, day trading, and swing timeframes.
Why Confluence Matters When You Already Have AI-Generated Levels
An AI-generated trade idea already gives you an entry, a stop-loss, and three scaled take-profit levels built around measured risk-reward. Adding Fibonacci retracement on top doesn't replace that structure — it validates it. When a 50% or 61.8% retracement zone lines up closely with an AI-suggested TP2 target, or when a shallow 38.2% pullback coincides with the suggested entry price, you get independent confirmation that the level is meaningful rather than arbitrary. This is especially useful because TP1, TP2, and TP3 are inherently a decaying probability structure — TP1 is reached more often than TP2, and TP2 more often than TP3, simply because price has to travel further to trigger each successive level. Fibonacci confluence helps you judge, zone by zone, whether the market has the structural room to reach that next target, or whether a level is more likely to hold as a wall.
Five-Minute Scalping: Pairing Entries with AI TP1 Confirmation
On the five-minute chart, the goal is speed and precision, not big structural moves. The scalping approach here is simple: wait for price to retrace into the 38.2%–50% Fibonacci zone of the most recent impulse leg, then check whether an AI-confirmed entry sits inside or very close to that same zone. If it does, you have two systems agreeing on the same few pips — a stronger case for a quick, tight-stop entry than either signal alone.
This setup performs best on low-spread pairs where the cost of entry doesn't eat into a tight TP1 target. USDCAD is a good example: recent tracked data shows the pair generating a high volume of setups with reliable follow-through into TP1 and TP2, which is exactly the behaviour scalpers want — quick, clean moves rather than choppy indecision. For BTCUSD scalps, the same logic applies around AI signal invalidation levels: if price breaks convincingly through the stop-loss zone the AI has flagged, that's your cue to step aside rather than average in, since invalidation on a five-minute chart tends to cascade quickly in either direction.
Day Trading Momentum Continuation with AI Signal Timing
Day traders operate on a slightly longer horizon, typically looking to ride a continuation move through a session rather than in and out within minutes. Here, Fibonacci extension levels beyond the 100% mark (the 127% and 161.8% zones) are worth comparing against AI TP2 and TP3 targets. When they cluster together, it suggests the AI's model and classic price-projection math are pointing at the same structural objective — a useful signal that the continuation has room to run rather than stalling early.
Timing also matters more for day trades than scalps. Momentum continuation setups tend to work best when entered shortly after a signal is confirmed rather than chased late, particularly around scheduled catalysts. With events like President Trump's public remarks or scheduled FOMC member commentary from Schmid, Logan, and Jefferson on the calendar, USD pairs and indices such as NDX and SPX can see momentum accelerate or reverse sharply within the same session — a day trading checklist should always include a quick scan of what's due on the economic calendar before entering an AI-confirmed breakout.
Swing Trading Gold: Placing TP3 Beyond Key Resistance
Swing trades benefit most from Fibonacci confluence on the higher timeframes, where retracement zones often coincide with genuine structural resistance rather than short-term noise. XAUUSD is a good case study — it has been among the most heavily analysed instruments on the platform recently, with a solid share of setups progressing through TP1 and TP2 before reaching TP3. When placing a TP3 target on a gold swing trade, check whether the AI's suggested level sits beyond a prior swing high or a 161.8% Fibonacci extension — if it does, that's a level with two independent reasons to expect a reaction, making it a more defensible place to bank the final third of a position.
A practical way to manage this: take partial profit at TP1 to lock in gains and reduce risk to breakeven, then hold the remaining runner toward TP2 and TP3. This lets a swing trade absorb overnight gaps and multi-day volatility without threatening the entire position, since the initial risk has already been recovered. Gold swing trades held through a weekend or overnight session should always have the stop-loss reassessed against fresh structure once markets reopen, rather than left untouched by default.
Sizing Stop-Loss Distance by Strategy
One of the most common mistakes is applying the same stop-loss logic across every timeframe. A five-minute scalp needs a stop tight enough that a single adverse wick doesn't wipe out several trades' worth of profit, typically placed just beyond the nearest micro-structure level. A swing trade, by contrast, needs enough room to absorb normal daily volatility and overnight gaps without being stopped out on noise — which usually means anchoring the stop beyond a daily or 4-hour swing point rather than an intraday one. The AI-generated stop-loss on each analysis already accounts for the instrument's typical volatility profile, but pairing it with your own Fibonacci-based structure check adds a second layer of confidence before you commit size to the trade.
What the Recent Data Shows
Over the past week of tracked analyses, the platform's daily win rate averaged in the high-60s percent range with an average risk-reward ratio near 1.9 — a reasonable baseline for judging whether a given day's conditions favour aggressive entries or more conservative confirmation. The strongest session of the week, Thursday, July 9, combined a high win rate with the best expected-value score of the period, while Tuesday, July 14 was comparatively the weakest, with both win rate and EV notably lower. That kind of day-to-day variance is normal and is exactly why confluence — rather than blind signal-following — matters: on stronger days, confluence setups tend to confirm quickly, while on weaker days the lack of alignment between Fibonacci structure and AI targets is often an early warning to reduce size. Across all tracked trades historically, the platform has maintained an all-time win rate of 54.2% with an average RR of 2.00, a useful long-run backdrop against which to judge any single week's performance.
Putting It Together
Before entering any AI-confirmed trade, run a quick three-point check: does the entry sit near a meaningful Fibonacci retracement, does TP2 or TP3 line up with a Fibonacci extension or prior structural level, and does the stop-loss distance make sense for the timeframe you're trading? If all three align, you're not just following a signal — you're trading a level with independent confirmation from two different analytical frameworks. For traders who want to track how these confluence setups perform over time, the Trade Tracking dashboard breaks down win rates and RR by strategy, while the Live Trades Scoreboard offers a transparent, read-only record of top-performing analyses across all users for the past two weeks. New traders looking to build the underlying technical skills referenced here can find structured lessons in the Trading Academy.
Analytical software only. We do not handle funds, make investments, or provide financial advice. Trading involves substantial risk and past performance does not guarantee future results. Always conduct your own research and consider your risk tolerance before making trading decisions.