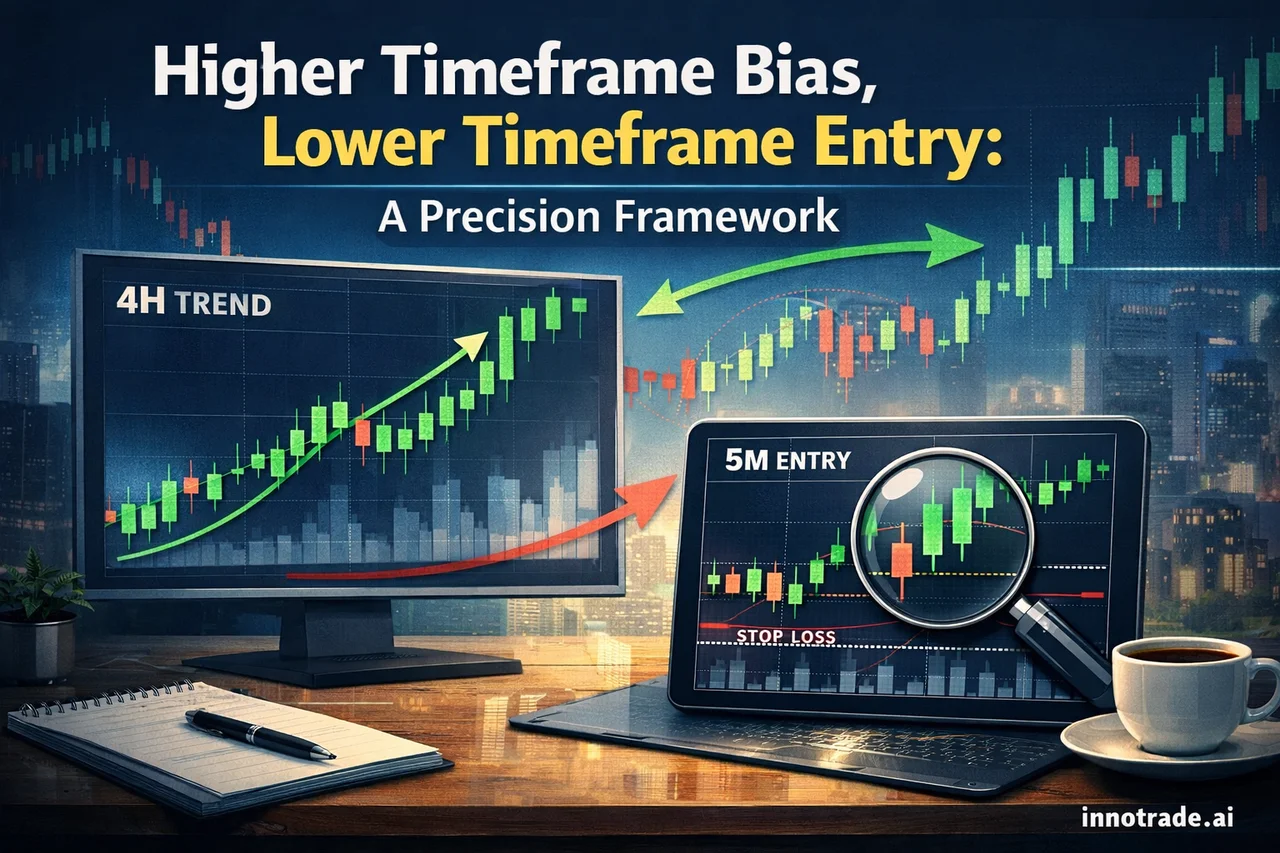
One of the most common mistakes retail traders make is treating every timeframe as an isolated decision. A trader spots a bullish setup on the 5-minute chart and enters without checking whether the 4-hour or daily trend is actually working against them. The result is a strategy that wins in choppy conditions and bleeds during trending ones — or vice versa. The fix is a disciplined higher timeframe bias, lower timeframe entry framework, and it's one of the most reliable ways to filter out low-quality setups before they ever reach your entry point.
Why Higher Timeframe Bias Comes First
The higher timeframe (4H, daily, or weekly) tells you the dominant direction of institutional order flow. The lower timeframe (1M, 5M, 15M) is simply where you refine your entry, tighten your stop-loss, and improve your risk-reward ratio. When these two align, the probability of a clean move increases significantly. When they conflict — for example, a bullish lower timeframe pattern forming inside a bearish daily structure — the setup should be treated with far more skepticism, regardless of how attractive the entry pattern looks in isolation.
This is exactly the structure behind every AI Analysis generated on the platform: a directional bias is established first, and the entry, TP1/TP2/TP3 levels, and stop-loss are then built around that bias rather than around an isolated candle pattern.
Lower Timeframe Entry Techniques for Scalpers
Once bias is confirmed, scalpers can use several precision entry techniques on the lower timeframe:
- Order block retest scalping: After a strong impulsive move breaks structure, price often returns to the last opposing candle before the breakout — the order block. Entering on this retest, with a stop just beyond the block, keeps risk tight while aligning with the higher timeframe direction.
- VWAP rejection scalping entry technique: During the London or New York session, price frequently tests VWAP as dynamic support or resistance. A rejection candle at VWAP, in the direction of the higher timeframe bias, is one of the cleanest intraday scalps available.
- Liquidity sweep reversal scalping entry: Watch for a quick wick through an obvious swing high or low — a stop hunt — followed by an immediate reclaim. This sweep-and-reverse pattern often marks exhaustion of the counter-trend move.
- Three touch trendline entry scalping method: A trendline validated by three separate touches becomes a high-confidence entry zone on the fourth approach, particularly when it aligns with the broader trend.
Lower Timeframe Entry Techniques for Swing Traders
Swing traders apply the same bias-first logic but with wider entries and more patience:
- EMA pullback continuation entry for swing trades: In a confirmed trend, waiting for price to pull back to the 20 or 50 EMA before re-entering avoids chasing extended moves and improves average entry price.
- Supply demand zone entry with AI TP targets: Marking untested supply and demand zones on the 4H chart and waiting for price to return gives a logical, structure-based entry that pairs naturally with layered take-profit targets.
- Donchian channel breakout swing trade rules: A break of the 20 or 55-period Donchian high/low, confirmed by a close outside the channel, is a mechanical, rules-based way to enter emerging swing trends without discretion.
- Asian session range breakout swing setup: The tight consolidation typical of the Asian session often precedes a directional breakout once London opens — entering on the break, in the direction of the daily bias, is a repeatable swing setup on pairs like AUDJPY and USDJPY.
Managing the Trade: From TP1 to the Runner
Entry is only half the strategy. How you manage the trade after it moves in your favor often determines whether a good setup becomes a great result. Two techniques are worth building into your routine:
Partial exit at TP1, breakeven runner strategy: Taking partial profit at TP1 and moving your stop-loss to breakeven on the remaining position removes emotional risk immediately. From that point, the trade is effectively "free," and you can let the runner work toward TP2 and TP3 without the fear of turning a winner into a loser.
Trailing stop after TP2 volatility strategy: Once TP2 is hit, market volatility often increases as more participants react to the move. Rather than holding a fixed TP3 target, trailing your stop behind recent swing points or an ATR-based buffer lets the trade capture extended momentum while protecting the gains already locked in.
It's worth understanding conceptually why win rates naturally decay from TP1 to TP3 — more price movement is required to reach each successive level, so fewer trades make the full journey. This is precisely why scaling out in stages, rather than betting everything on a single target, tends to produce steadier equity curves over time.
What Recent Data Shows
Looking at the platform's tracked performance over the past week, the daily win rate ranged from roughly 22% on the weakest session up to the mid-60s on the strongest, with the average risk-reward ratio across the week sitting close to 1.85. The strongest session of the period combined a solid win rate with an average RR near 2.8 and the highest expected value (EV) score of the week — a reminder that RR and EV, not win rate alone, tell the fuller story of a trading day's quality. The weakest session, by contrast, saw both win rate and RR compress simultaneously, which is exactly the kind of stretch a breakeven-runner approach helps traders survive without giving back prior gains.
Over the past two weeks, instruments like XAUUSD and BTCUSD have seen consistent TP1 follow-through relative to trade volume, while pairs like AUDJPY showed a steadier hit-rate progression toward TP2 and TP3 — useful context when deciding which instruments suit a scalping approach versus a slower swing framework. All of this activity, along with the platform's broader all-time win rate near 54% and an average RR around 2.00 across tracked trades, is tracked transparently and synced with independent verification sources.
Putting It Together
A repeatable process looks like this: confirm bias on the higher timeframe, wait for one of the lower timeframe entry patterns above to align with that bias, size the position around a stop-loss placed beyond clear structure, and manage the trade in stages — partial at TP1, breakeven stop, trail after TP2. This structure is exactly what AI Analysis is built to surface automatically, whether you're scalping intraday sessions with ScalpHunter or holding multi-day swing positions.
For traders who want to see how this plays out over time on their own account, the Trade Tracking dashboard breaks down win rate, RR, and strategy performance individually, while the Live Trades Scoreboard offers a transparent, public record of top-performing analyses across all users as proof of past results. New traders exploring these concepts in more depth should also check the Trading Academy, and anyone with questions about how signals are generated can find detailed answers in the FAQ.
Analytical software only. We do not handle funds, make investments, or provide financial advice. Trading involves substantial risk and past performance does not guarantee future results. Always conduct your own research and consider your risk tolerance before making trading decisions.