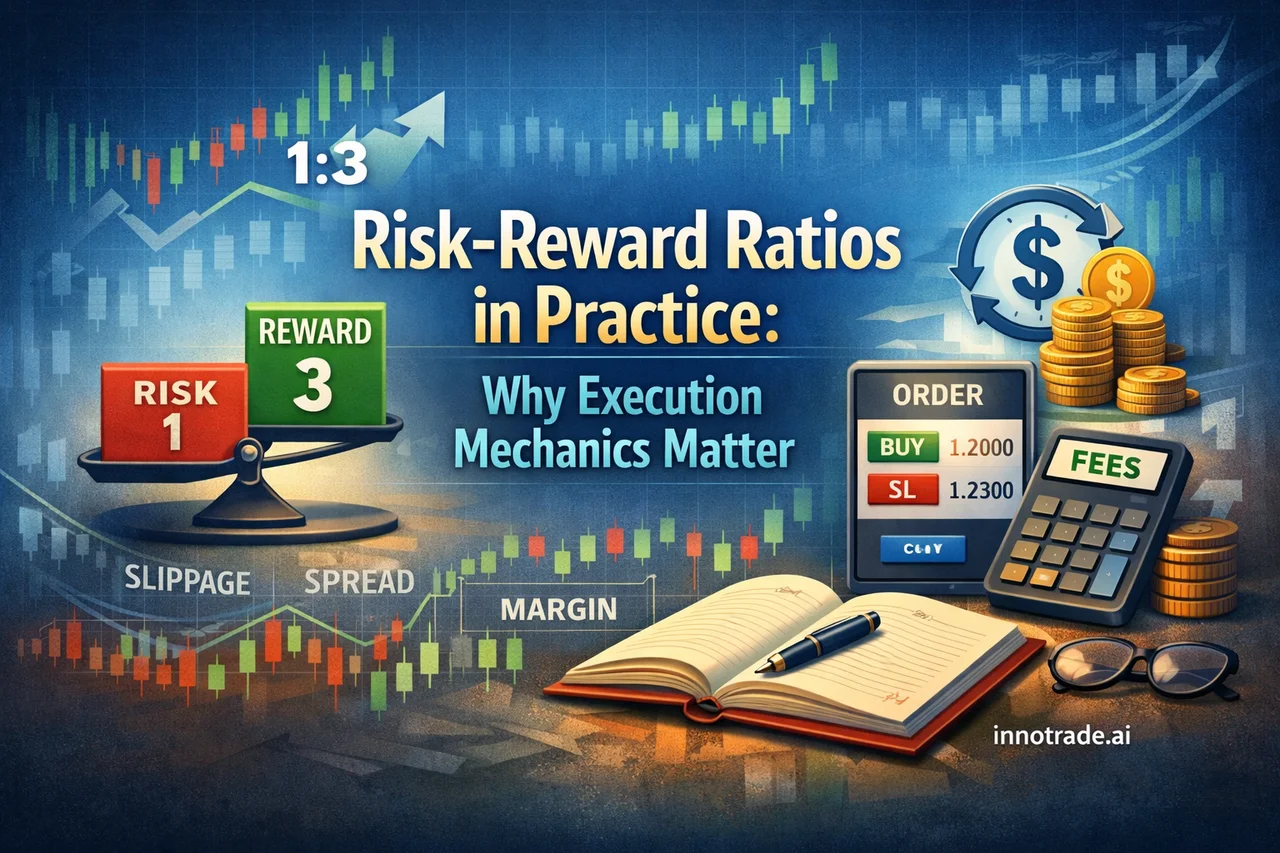
Every trader has heard the phrase "risk one to make three." It's one of the first concepts taught in trading education, and for good reason — a favorable risk-reward ratio means you can be wrong more often than you're right and still come out ahead over time. But there's a gap between the risk-reward ratio you calculate on a chart and the one you actually realize once a trade is live. That gap is built entirely from execution mechanics: how your order fills, how the spread behaves, what your broker charges to hold a position overnight, and whether you're even measuring your results accurately in the first place.
This article walks through what a 1:3 risk-reward ratio really means, and then digs into the practical mechanics — order types, slippage, spreads, margin, rollover, and journaling — that determine whether your theoretical edge survives contact with the live market.
What Does a Risk-Reward Ratio of 1:3 Actually Mean?
A 1:3 risk-reward ratio simply means that for every unit of capital you're risking (the distance from entry to stop-loss), your target profit is three times that distance. If you're risking 20 pips on a EUR/USD long, a 1:3 ratio means your take-profit sits 60 pips away. Mathematically, a strategy with a 1:3 ratio only needs to win roughly 25-30% of the time to break even, which is why experienced traders often care more about the ratio than the win rate alone.
On AI-generated analysis, this is exactly why entries come paired with three separate take-profit levels rather than one. TP1 typically sits at a more conservative distance, with TP2 and TP3 extending the reward side further out — giving traders the option to bank partial profit early while letting the remainder run toward a larger multiple of the initial risk.
Order Types: Market, Limit, and Stop — Explained
The type of order you use to enter a trade directly affects the price you actually get filled at, which in turn affects your real risk-reward ratio.
- Market order: Executes immediately at the best available price. Fast, but during volatile conditions the fill price can differ from what you saw on screen.
- Limit order: Only fills at your specified price or better. You control the entry price precisely, but there's no guarantee the market reaches it.
- Stop order: Triggers a market order once price reaches a certain level — commonly used for breakout entries or to place a stop-loss.
The difference between a market order and a stop-limit order becomes important around news releases or breakout setups. A stop-limit order gives you a price ceiling (or floor) beyond which the order won't fill, protecting you from an unfavorable fill — but it can also mean missing the trade entirely if price gaps past your limit.
Reading a Forex Quote and Why the Spread Matters
Every currency pair quote shows two prices: the bid (what you can sell at) and the ask (what you can buy at). The difference between them is the spread, and it's effectively a built-in cost of entering a trade. Under normal conditions, major pairs like EUR/USD carry tight spreads. But understanding bid-ask spread widening during news is critical — around high-impact releases, spreads can expand significantly for a short window as liquidity providers pull back. This is one of the reasons economic events, such as the scheduled President Trump remarks affecting USD this week, are worth being aware of even if you're not trading the news directly. A trade planned around a tight spread can see its effective entry shift unfavorably if it's triggered during that window.
Slippage and the Demo-vs-Live Gap
Slippage on market execution accounts happens when your order fills at a different price than requested, usually during fast-moving markets or low liquidity. It's a normal part of trading, not a sign anything is broken — but it does mean your realized risk-reward ratio can differ slightly from your planned one.
This is also where the difference between a demo account and a live account becomes obvious. Demo accounts often simulate near-perfect fills, while live accounts are subject to real liquidity conditions, occasional slippage, and genuine emotional pressure from risking actual capital. Traders transitioning from demo to live often find their execution — and their discipline — behaves differently once real money is on the line. It's a good reason to start any new approach, including AI-assisted analysis, on a smaller live position size before scaling up.
Margin Level, Position Sizing, and Rollover Costs
Margin level (your equity divided by used margin, expressed as a percentage) is different from a margin call — the margin level is a live health indicator, while a margin call is the broker's warning that it's dropped too low. Understanding this distinction matters when calculating position size using account equity: risking a fixed percentage of equity per trade (commonly 1-2%) keeps your margin level comfortably away from call territory even during a losing streak.
For swing positions held overnight, rollover interest also enters the equation. Depending on the interest rate differential between the two currencies in a pair, holding a position past the daily rollover cutoff can add or subtract a small amount from your account each night. It's rarely dramatic on a single trade, but across a multi-day swing position it can shift your effective risk-reward ratio slightly — worth factoring in in when comparing a scalp setup to a multi-day swing trade.
Why a Trading Journal Reveals Your Real Ratio
A trading journal is simply a record of your planned entry, stop, targets, and actual fills for every trade. Its value is that it exposes the gap between theoretical and realized performance — the slippage, the spread cost, the rollover charges — that a chart alone won't show you. This is precisely the purpose behind Trade Tracking, which logs each analysis a user acts on and compares planned levels against actual outcomes over time, broken down by strategy and instrument.
What the Data Shows in Practice
Execution friction is real, but it doesn't have to erase an edge. Over the past week, the platform's tracked analyses averaged a risk-reward ratio in the low 2s, with the strongest session — Sunday, July 26 — combining a win rate above 54% with an average RR near 2.83. The weakest stretch, Saturday, July 25, saw both win rate and RR compress, a reminder that even a sound approach has quieter days. Across all tracked trades historically, the platform has held an all-time win rate around 54.1% with an average RR near 2.01 — figures that are only meaningful because they account for real execution, not idealized chart math. Results like these are also published transparently and synced with independent tracking, and the Live Trades Scoreboard offers a read-only look at some of the strongest verified outcomes from recent weeks, purely as a record of past performance.
The Takeaway
A risk-reward ratio is only as good as the execution behind it. Before trusting a 1:3 setup, understand how your order type, the spread, potential slippage, and any overnight costs might shift the numbers. Keep a journal, size positions against your account equity rather than a fixed lot size, and treat demo results as a starting point rather than a guarantee of live performance. For traders looking to build this discipline systematically, the Trading Academy covers these mechanics in more depth, and the FAQ answers common questions about how execution and analysis work together on the platform.
Analytical software only. We do not handle funds, make investments, or provide financial advice. Trading involves substantial risk and past performance does not guarantee future results. Always conduct your own research and consider your risk tolerance before making trading decisions.