Stop-Loss Placement: The Decision That Defines Your Trading Edge
Every trader knows they need a stop-loss. Far fewer traders know how to place one correctly. The difference between a stop that protects your capital and one that gets picked off before your trade plays out often comes down to methodology — specifically, understanding where price has no business going if your thesis is correct.
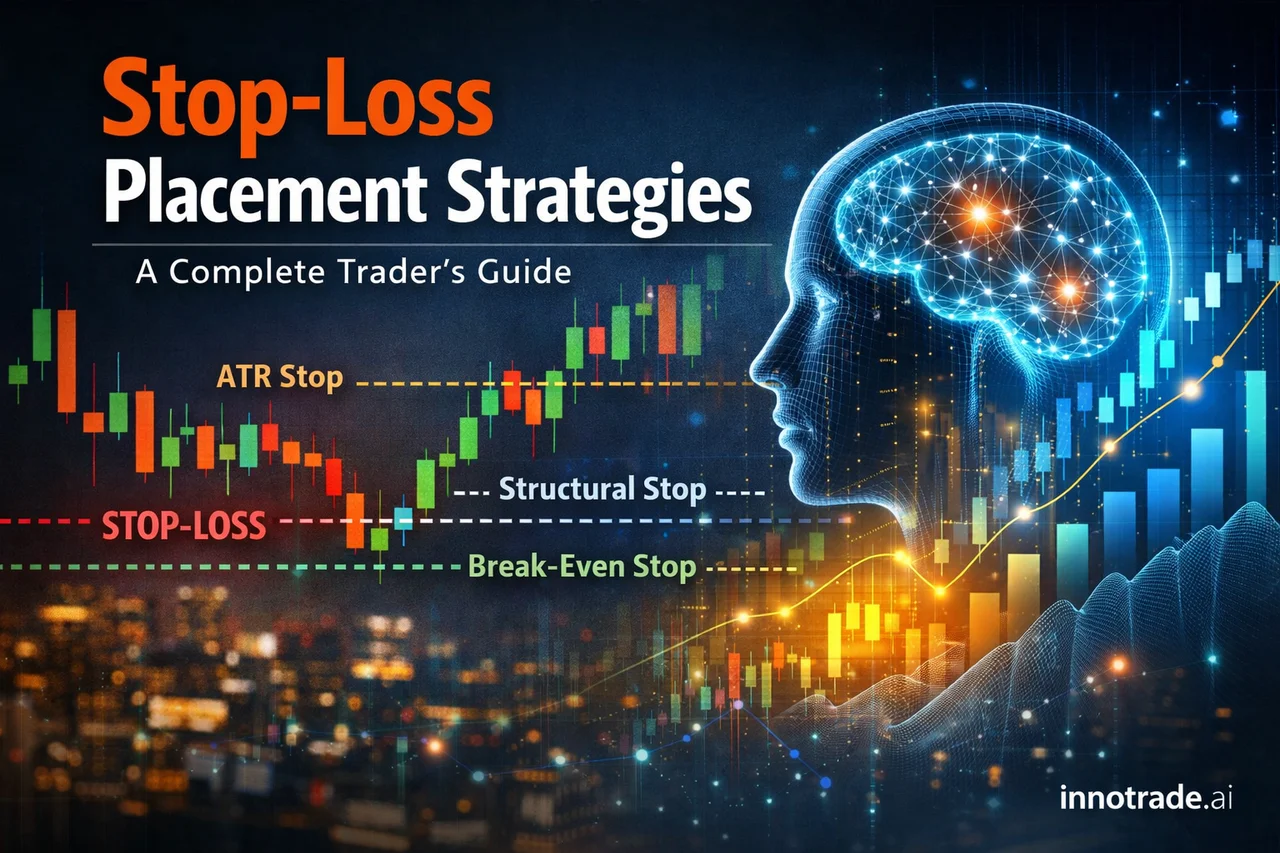
This guide covers the three most practical stop-loss methods used by serious retail traders: structural placement, ATR-based placement, and the breakeven stop. We'll also explore how AI-assisted trading tools apply these principles at scale — and what the platform's recent performance data reveals about how consistent stop discipline actually affects outcomes.
Why Most Retail Stop-Losses Fail
Before covering the methods, it's worth understanding the most common mistake: placing stops based on a dollar amount you're willing to lose rather than on market structure. This produces stops that are either too tight (getting hit by normal noise before the move plays out) or too wide (turning manageable losses into account-damaging ones).
A well-placed stop answers a structural question: if price reaches this level, my trade idea is invalidated. That's the only logically sound reason to exit. Everything else is noise management dressed up as risk control.
For new traders looking to build a solid foundation on this, the Trading Academy walks through risk fundamentals in plain language before introducing more complex execution concepts.
Method 1: Structural Stop-Loss Placement
Structural placement is the gold standard for most trading timeframes. The idea is straightforward: your stop goes beyond a meaningful structural level — a swing high, swing low, order block, or consolidation zone — that, if broken, tells you the market has shifted against your position.
For Long Positions
Place your stop just below the most recent significant swing low or support structure. If price breaks below that level with momentum, the bullish thesis is broken. A buffer of a few pips or a percentage of ATR (more on that below) is standard to avoid wicks triggering you prematurely.
For Short Positions
The mirror applies: stop goes just above the swing high or resistance zone your analysis identified as the key level. If price reclaims that area convincingly, the bearish setup is no longer valid.
Ranging vs Trending Markets Matter Here
Learning how to identify ranging versus trending market conditions is critical before applying structural stops. In a clean trend, swing highs and lows are well-defined and stops can be placed with reasonable precision. In a ranging, choppy market, structure becomes far less reliable — levels get breached and reclaimed constantly, making structural stops vulnerable to repeated false invalidations. During low-liquidity periods, this problem compounds. AI signal filtering during low-liquidity market hours is one of the practical advantages of algorithmic analysis — the system can avoid generating entries during sessions or windows where the signal quality historically degrades.
Method 2: ATR-Based Stop-Loss Placement
The Average True Range (ATR) measures how much a market typically moves over a given period. Using it for stop placement solves a key problem: it adapts to current volatility rather than applying a one-size-fits-all pip distance.
A common approach is to set your stop at 1.5× to 2× the current ATR below your entry for a long, or above it for a short. During high-volatility sessions — particularly around economic events — you'd lean toward the wider end. During quiet Asian session conditions, the tighter end may be appropriate.
This directly connects to your risk per trade percentage. Once you know your stop distance (in pips or points), you can calculate your lot size so that if stopped out, you lose no more than your predetermined risk percentage — typically 1% to 2% of account equity for most retail traders. Beginners are better served staying at the lower end of that range until their edge is statistically proven over time.
Here's how the logic flows:
- Determine your ATR-based stop distance (e.g., 40 pips on EUR/USD)
- Decide your risk per trade (e.g., 1% of a $10,000 account = $100)
- Calculate your lot size so that 40 pips of movement equals $100 loss
- This gives you a position size grounded in market reality, not arbitrary round lots
Traders who skip this calculation and default to standard lot sizes are effectively gambling on volatility not exceeding their account's tolerance — a bet that markets will eventually collect on.
Method 3: The Breakeven Stop-Loss
What does breakeven stop-loss mean in trading? It means moving your stop-loss to your entry price once the trade has moved sufficiently in your favour — typically after price has reached or cleared your first take-profit level (TP1). At that point, your position carries zero risk of a net loss. You've locked in the psychological and financial foundation to let the trade run toward TP2 or TP3 without anxiety about giving back open gains.
The breakeven move is not automatic — it requires judgment. Moving to breakeven too early (before price has cleared a nearby resistance or liquidity cluster) frequently results in the trade reversing just enough to stop you out, then continuing in your original direction without you. This is one of the most frustrating experiences in trading, and it's almost always caused by premature stop management.
A practical rule: only move to breakeven after TP1 is hit and price has demonstrated at least a minor retest of the breakout level that held. That combination — a TP1 hit plus a successful retest — is a reasonable signal that the original thesis is intact and the position can be managed more aggressively.
This is precisely the logic that structured multi-level exit frameworks are built on. When an AI analysis generates entries with TP1, TP2, and TP3 levels, the implied trade management is progressive: take partial profits at TP1, move to breakeven, then allow the remaining position to target TP2 and TP3 with no downside risk remaining. You can see how the AI analysis tool generates these structured entries with pre-defined levels built in.
What the Platform Data Shows About Stop Discipline
Looking at this past week's tracked analyses, the relationship between stop placement quality and overall expected value becomes tangible. The week covered seven trading days with meaningful variation in conditions — some sessions with strong directional follow-through, others with choppier, mean-reverting behaviour.
The strongest day of the period was Thursday, July 9, which posted a win rate of 80.0% and an average risk-reward ratio of 2.17. The weakest day by expected value score was Tuesday, July 14, with a 50.0% win rate and an average RR of 1.65. The difference isn't just in direction-calling accuracy — it's in the quality of the entries and stop placements relative to market conditions that day.
Averaged across the full seven-day window, the platform's tracked analyses delivered a weekly win rate consistently above 50% on every single day, with average RR ratios well above 1.0 — meaning even the losing trades were statistically offset by winners that ran further. That is the compounding effect of disciplined stop placement at work: keeping losses small enough that the winning trades drive positive expected value even when the win rate doesn't approach 70% or 80%.
Across all tracked trades in the platform's history, the all-time win rate sits at 54.2% with an average RR of 1.99. A 54% win rate with nearly 2:1 average reward-to-risk is a mathematically profitable combination — but only because the stop-loss discipline on the losing side has been consistent enough to keep those 46% of losing trades from erasing the gains.
Liquidity Sweeps and Stop Placement: A Practical Warning
One of the most common frustrations retail traders voice is getting stopped out just before the move they expected occurs. This often involves liquidity sweeps — moments when institutional or algorithmic order flow briefly pushes price below a visible swing low (or above a visible swing high) to fill buy or sell orders sitting at those levels, before reversing sharply in the original direction.
Understanding how this works doesn't require a conspiracy theory about market manipulation — it's simply how large orders get filled when the market lacks sufficient liquidity at current prices. The practical implication for stop placement: stop just below a swing low is often the most obvious and therefore most vulnerable location. Adding a buffer beyond the swing low, or using ATR to size the stop rather than placing it directly at a visible technical level, reduces your exposure to these sweeps.
Some traders use higher timeframe bias to filter intraday entries precisely because of this. If the daily chart shows a clear uptrend and you're entering a 15-minute long setup, placing your stop below the daily structure rather than the 15-minute swing low gives the trade room to breathe through intraday noise while staying logically protected.
Putting It Together: A Stop-Loss Placement Checklist
- Identify the structural invalidation point — where does price prove your thesis wrong?
- Check ATR — is your structural stop within a reasonable multiple of current volatility, or dangerously tight?
- Calculate your lot size — risk no more than 1–2% of account equity at that stop distance
- Account for liquidity zones — is your stop sitting exactly on an obvious level that could be swept?
- Plan your breakeven trigger — at what point will you move to breakeven, and what confirmation do you need first?
- Consider market conditions — trending markets support tighter structural stops; ranging or low-liquidity conditions demand more width or avoidance altogether
For traders using AI-generated analyses, these calculations are embedded in the signal — but understanding the logic behind them ensures you manage the trade correctly once it's live. The Trade Tracking dashboard lets you review your own historical stop-loss performance across all your analyses, giving you a personal data set to identify whether your execution is preserving or undermining the underlying edge.
Final Takeaway
Stop-loss placement is not a defensive afterthought — it is one of the primary determinants of whether your trading strategy has positive or negative expected value over time. Structural stops, ATR-calibrated buffers, and disciplined breakeven management form a coherent system when applied together. The data consistently shows that traders who get this right don't need extraordinary win rates to be profitable: a 54% win rate with a disciplined approach to stop placement and multi-target exits is more than enough to generate sustainable results.
If you're still building the foundational knowledge to apply these concepts confidently, the Trading Academy is a practical starting point. And if you want to see how the full AI analysis framework handles entries, stop placement, and TP levels in a live environment, the 7-day free trial gives you direct access without commitment.
Analytical software only. We do not handle funds, make investments, or provide financial advice. Trading involves substantial risk and past performance does not guarantee future results. Always conduct your own research and consider your risk tolerance before making trading decisions.