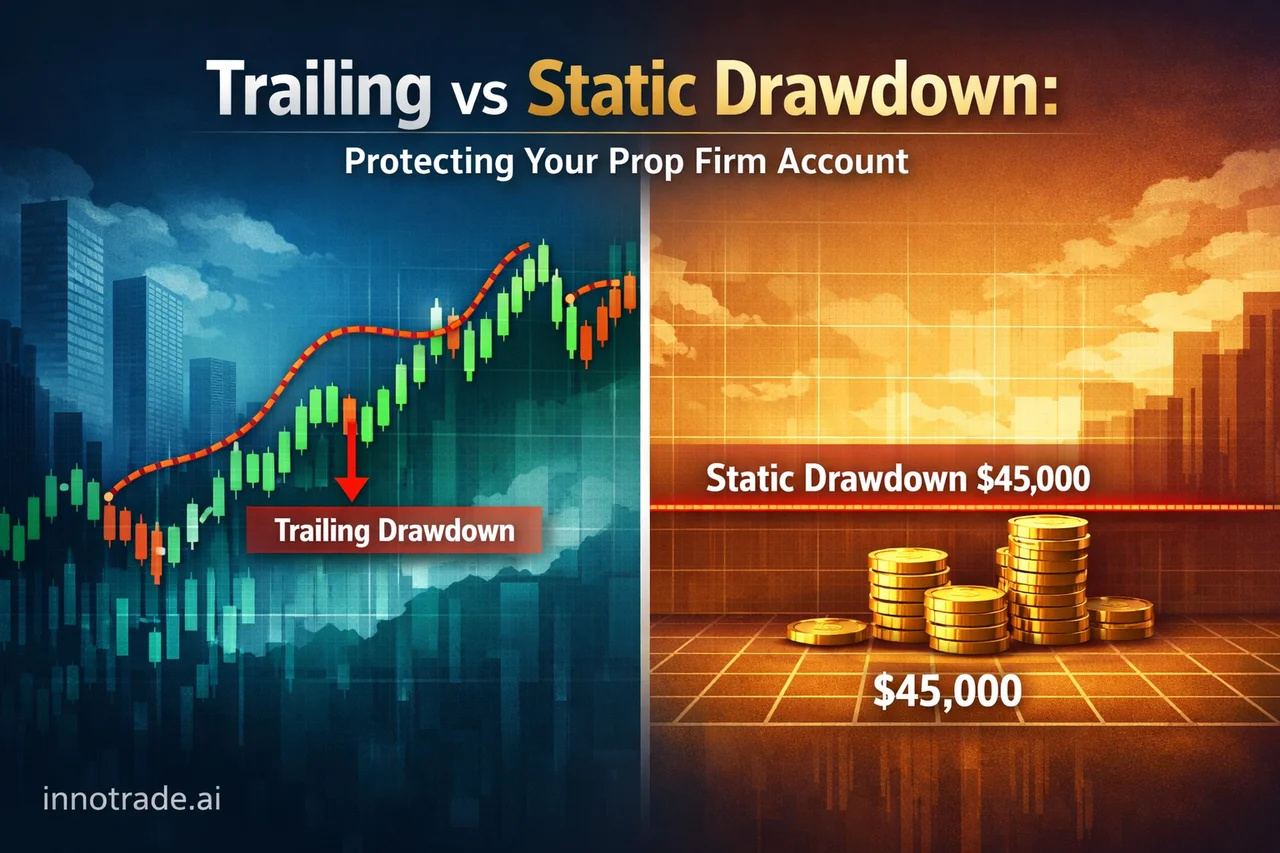
Every prop firm challenge lives or dies by one number most traders barely understand until they've breached it: the drawdown limit. But not all drawdown rules are built the same. Trailing drawdown and static drawdown look similar on paper — a maximum loss threshold — yet they behave completely differently once your equity curve starts moving, and confusing the two has ended more challenges than bad entries ever have.
Static Drawdown: The Fixed Floor
A static drawdown is anchored to your starting balance. If a $50,000 account has a 10% static drawdown, your floor is $45,000 — full stop, regardless of how much profit you've banked along the way. Once you're up $8,000, that floor doesn't move. It's the more forgiving structure because profits give you genuine breathing room.
Trailing Drawdown: The Moving Target
Trailing drawdown is a different animal. The floor moves up as your equity climbs (usually based on closed-trade balance or, in some firms, on real-time equity including open positions). Bank $3,000 in profit and your allowable loss threshold rises with it. This is where traders get caught: a string of well-earned wins can quietly erase your cushion if you don't track exactly which version of trailing rule your firm uses. Trading a strategy with wide stop-losses on a trailing-drawdown account is a common and entirely avoidable way to fail a challenge that was otherwise going well.
This is precisely where structured, data-driven analysis earns its keep. Traders don't need more signals — they need consistent, quantifiable risk parameters they can plan around before the trade is ever placed.
Why Consistency Beats Aggression Under Either Rule Set
Regardless of which drawdown model your firm uses, the traders who pass challenges reliably share one habit: they know their risk-reward profile before they click buy or sell, and they don't deviate from it mid-trade. Our AI analysis tool is built around exactly this discipline — every generated setup comes with a defined entry, stop-loss, and three staggered take-profit levels (TP1, TP2, TP3), so the risk on the table is known in advance rather than improvised.
That staggered TP structure matters more for prop challenges than most traders realize. Scaling out at TP1 locks in partial gains and reduces exposure early, TP2 captures the bulk of a well-formed move, and TP3 is reserved for the minority of trades that fully extend. Naturally, each level converts at a lower rate than the one before it — TP1 hits more often than TP2, which hits more often than TP3 — and that decay is exactly why scaling out rather than swinging for a single target is a more drawdown-friendly way to trade a funded account, whether the drawdown floor is fixed or trailing.
What the Last Week of Data Actually Shows
We don't believe in dressing up performance claims, so here's the raw picture from the past seven days of tracked platform activity. Win rates ranged from a soft 22.2% on Sunday, August 9 up to 75.0% on Monday, August 10 — which also carried the strongest average risk-reward of the week at 3.24 and the highest EV score of the period. Averaged across all seven days, the platform's win rate sat around 52.0% with an average RR near 2.28 — figures that sit comfortably in realistic territory rather than anything inflated.
That Sunday dip is worth dwelling on, not hiding. It was the weakest session of the period by EV score, with a lower average RR of 2.12 to match. Weeks like this are the honest reality of trading — even a data-driven process has sessions where market structure doesn't cooperate. What matters for a prop firm account, particularly one on a trailing drawdown, is that the losing days stayed contained rather than compounding into a curve-breaking sequence. That containment is the entire point of defining stop-loss and position size before entry, not adjusting them after a trade starts moving against you.
Zooming out, across all tracked trades on the platform, the all-time win rate has held at 53.9% with an average RR of 2.01 — context that shows the recent week's numbers are broadly in line with the platform's longer-term track record rather than a one-off hot streak.
News Events Are a Trailing Drawdown Trap
High-impact releases like an RBA Rate Statement or press conference can whipsaw AUD pairs within seconds of release, and volatility spikes are exactly when a trailing floor can jump against a trader mid-position. Many funded traders have learned the hard way that holding a swing position through a scheduled high-impact event isn't a strategy — it's a coin flip against your own drawdown rule. Checking the economic calendar alongside your analysis before entering a trade is a small habit that prevents a large, avoidable mistake.
Symbols Worth Watching Recently
Over the past two weeks, XAUUSD has been the most heavily analysed instrument on the platform, showing consistent TP1 follow-through and a reasonable rate of setups progressing all the way to TP3. USDCAD and AUDJPY have also shown steady TP-level conversion, while BTCUSD and XRPUSD have run cooler, with fewer setups reaching deeper TP levels in that window. None of this is a guarantee of future performance — it's simply what the recent data shows, and it reinforces why position sizing per instrument matters as much as the entry signal itself.
The Actionable Takeaway
Before you take on a challenge, know exactly whether your firm uses static or trailing drawdown, and read the fine print on how the trailing version calculates its floor — balance-based or equity-based. Then size every trade so that even a losing streak similar to the weakest days we've shown here wouldn't touch your account's real limit. Tools like Trade Tracking let you monitor your own win rate and RR trends over time so you can verify your process is holding up under your specific drawdown rule, and our Live Trades Scoreboard offers transparent, verified proof of top-performing analyses from the past two weeks if you want to see real results rather than take our word for it. If you're new to structured risk management, the Trading Academy covers the fundamentals in plain language, and the FAQ answers common questions about how the platform's analysis and statistics are calculated.
Passing a prop firm challenge isn't about finding a strategy that never loses — it's about respecting a drawdown structure you fully understand, trade after trade, even through the inevitable rough week.
Analytical software only. We do not handle funds, make investments, or provide financial advice. Trading involves substantial risk and past performance does not guarantee future results. Always conduct your own research and consider your risk tolerance before making trading decisions.