Ask a new trader why they opened five positions instead of one, and you'll usually hear some version of "diversification." But if those five positions were EUR/USD, GBP/USD, EUR/JPY, EUR/GBP, and NZD/USD long, that trader didn't spread their risk — they concentrated it. Understanding currency pair correlation is one of the most overlooked skills in retail trading, and it's the difference between genuine risk management and an illusion of it.
What Correlation Actually Means
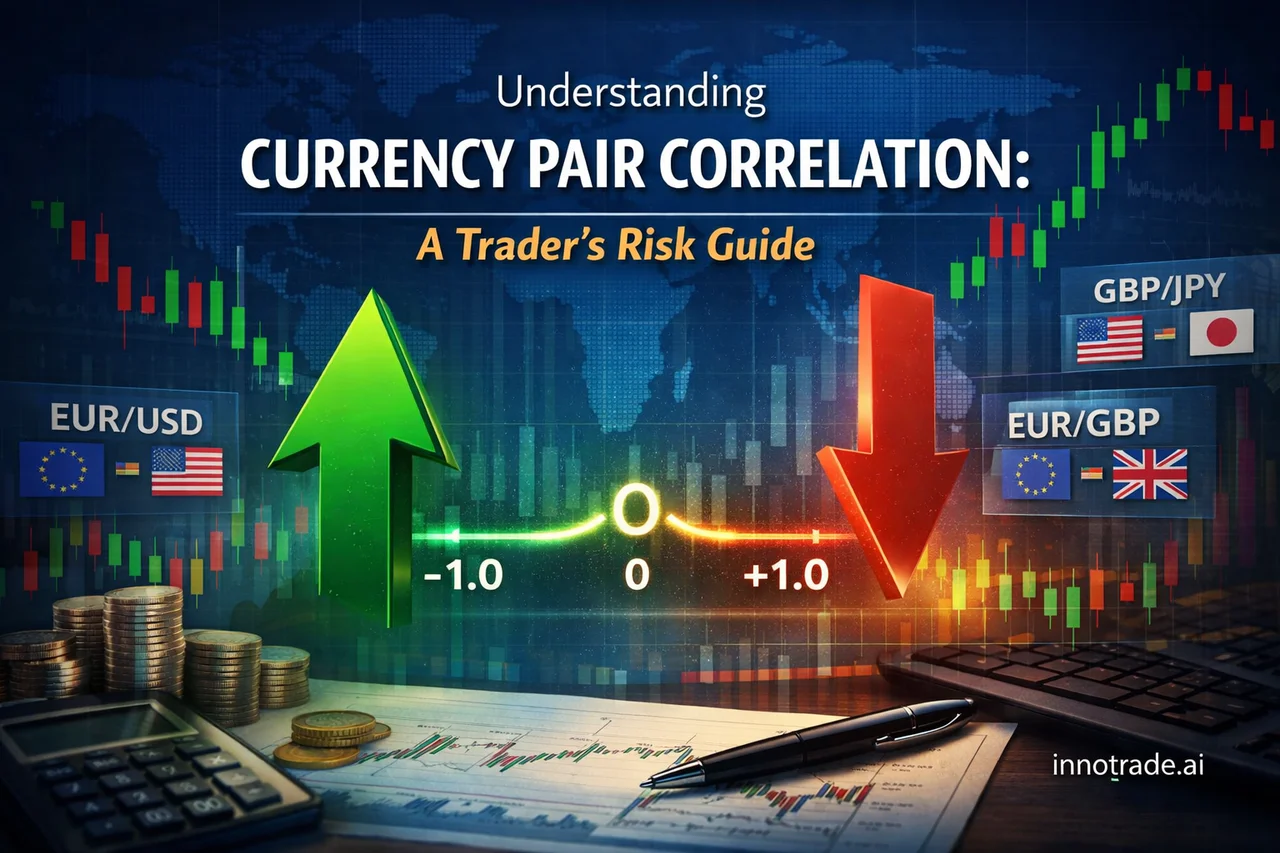
Correlation measures how closely two instruments move in relation to each other, expressed on a scale from -1.0 to +1.0. A correlation near +1.0 means two pairs tend to move in the same direction at the same time. A correlation near -1.0 means they tend to move in opposite directions. A correlation near 0 means there's little to no relationship at all.
This isn't abstract theory — it shows up constantly across the instruments tracked on innotrade.ai, from major forex pairs like USDCAD and EURJPY to metals like XAUUSD and crypto assets like BTCUSD and XRPUSD.
Positive Correlation Example
EUR/USD and GBP/USD are classic positively correlated pairs. Both are priced against the US dollar, so when broad USD strength or weakness dominates the session — often driven by events like an FOMC member speaking or a shift in Treasury yields — both pairs frequently move together. A trader who goes long EUR/USD and long GBP/USD isn't running two independent trades; they're running one large USD-short position split across two tickets.
Negative Correlation Example
USD/CHF, by contrast, often moves inversely to EUR/USD because of how the US dollar sits on the opposite side of both pairs' base structure. A trader long EUR/USD and long USD/CHF at the same time is effectively fighting themselves — one position's gain is likely to be offset by the other's loss, and vice versa.
Cross-Asset Correlation
Correlation isn't limited to forex. Risk-sensitive currencies like AUD and NZD often move together with broader risk appetite, while safe-haven flows can pull JPY and gold (XAUUSD) in a similar direction during periods of uncertainty. When the RBA or BOC issues commentary — as seen recently with the RBA Assist Governor's remarks affecting AUD, or BOC Governor Macklem's comments moving CAD — pairs like AUDJPY and USDCAD can react in tandem with other correlated instruments even though they sit in entirely different corners of the market.
Why This Matters for Position Sizing
The real danger of ignoring correlation isn't a single bad trade — it's silent overexposure. If you risk 1% of your account on each of four positions that are all highly correlated, you haven't diversified into four separate 1% risks. You've built one concentrated position with roughly 4% of exposure to the same underlying market driver. If that driver moves against you, all four trades lose together.
Diversification only works when the things you're diversifying into actually behave differently from each other.
This is exactly why understanding your own trade footprint matters. On Trade Tracking, users can review their open and historical positions side by side — a useful habit for spotting when several "different" trades are actually leaning on the same currency or the same macro theme.
What Recent Data Shows About Spreading Risk
Looking at the past week of tracked analyses across the platform, performance varied meaningfully day to day — a reminder that no single instrument or day should carry your entire trading plan. Across the seven most recent sessions, win rates ranged from a difficult stretch in the mid-teens up to a standout session where the AI's calls lined up unusually well, with the week as a whole averaging a win rate near 52.0% and an average risk-reward ratio around 2.13.
The weakest session of the period landed on Friday, September 18, with a win rate of 16.7% and an average RR of 2.07 — a useful reminder that even a sound analytical process will hit rough patches. The strongest session, by contrast, closed out the week on Saturday, September 19, posting the highest EV score of the period. Notably, the days with the healthiest EV scores weren't necessarily the ones with the highest single-day win rate — Monday, September 14 combined a solid 57.1% win rate with a stronger average RR of 3.22, producing one of the best EV outcomes of the week. That's the same principle as correlation risk in miniature: a good outcome depends on how the pieces interact, not just the number of trades you take.
How to Manage Correlation Risk in Practice
- Group your open trades by underlying driver. Before opening a new position, ask what currency, commodity, or macro theme it shares with trades you already hold.
- Reduce position size on correlated setups. If two signals are highly correlated, consider treating them as one combined risk allocation rather than two full-sized ones.
- Mix strategy types and timeframes. Blending scalping, day trading, and swing setups across less-correlated instruments — something covered in more depth in the Trading Academy — naturally reduces the odds that every position reacts identically to the same headline.
- Use verified performance context, not gut feel. Reviewing how different instruments have actually behaved recently, rather than assuming correlation from memory, leads to better sizing decisions.
Innotrade.ai's Analysis tool covers a wide spread of asset classes — forex majors and crosses, metals, crypto, and major indices — precisely because true diversification means having genuinely uncorrelated options available, not just more charts to look at. For traders who want a broader read on how the AI's calls have performed across instruments over time, the Live Trades Scoreboard offers a transparent, read-only look at recent top-performing analyses across the platform, purely as a record of past results.
The Takeaway
Correlation is the invisible variable behind a lot of unexpectedly large losing days. Two, three, or five open trades can feel like a diversified portfolio while functioning as one oversized bet on a single macro theme. Before your next multi-position session, take thirty seconds to ask: are these trades really independent of each other, or am I just spreading the same risk across more tickets? That single habit will do more for your risk management than almost any indicator you could add to a chart.
Analytical software only. We do not handle funds, make investments, or provide financial advice. Trading involves substantial risk and past performance does not guarantee future results. Always conduct your own research and consider your risk tolerance before making trading decisions.