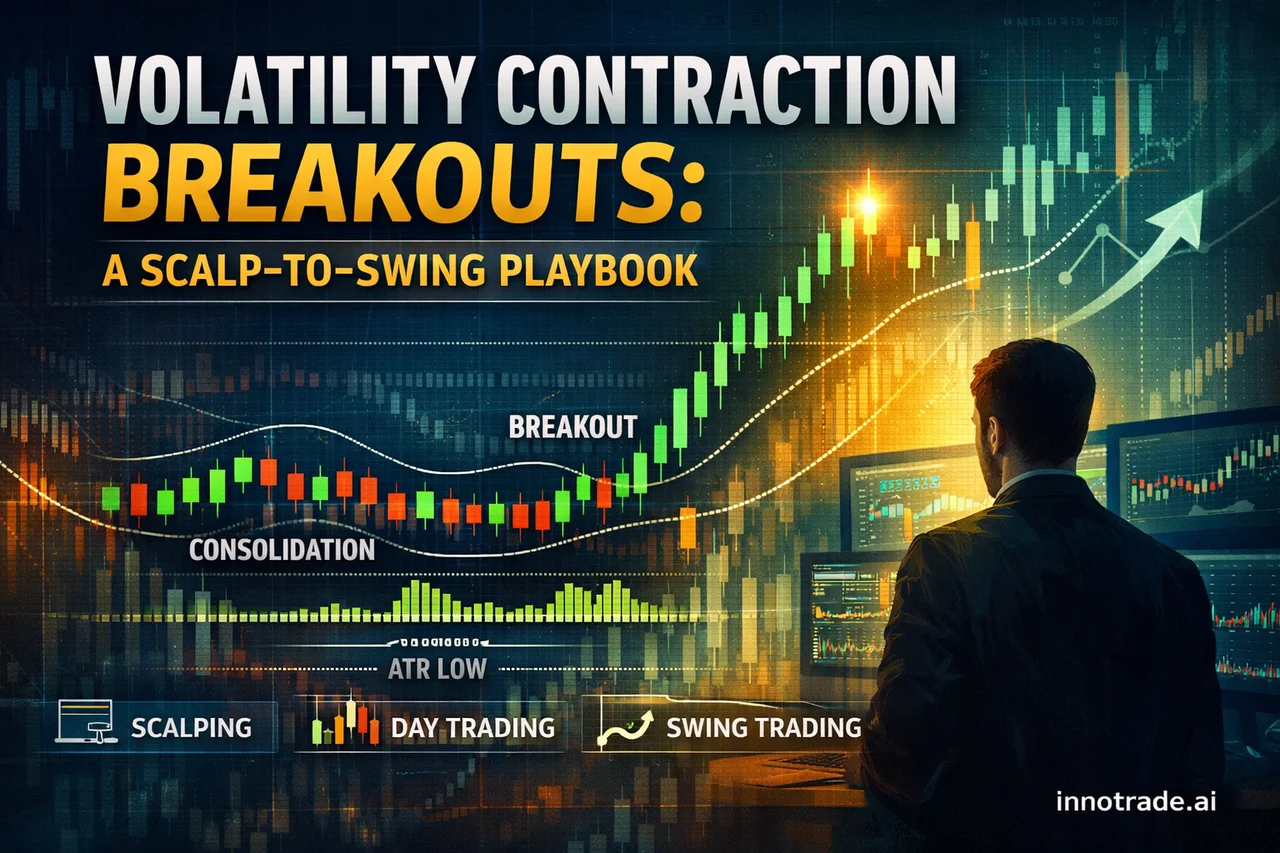
Every trending move that fills a chart with clean green candles was preceded by something far less exciting: a period of contraction. Ranges tighten, Bollinger Bands pinch toward the middle line, and average true range (ATR) readings drop to multi-day lows. Traders who recognize this coiling phase — rather than chasing the breakout after it's already extended — consistently get better entries and cleaner risk-reward math. This guide walks through how to trade volatility contraction across three timeframes: scalping, day trading, and swing trading, and how each style maps onto the entry, stop-loss, and staggered take-profit structure used in AI-generated analysis on the platform.
Why Volatility Contraction Precedes the Real Move
Volatility is cyclical. Periods of compressed range (low ATR, narrowing Bollinger Bands) are followed by expansion because liquidity and interest eventually force a resolution. The mistake most retail traders make is entering the breakout candle itself — often the worst possible price, with the tightest realistic stop already invalidated. The better approach is identifying the squeeze before it resolves, then having predefined entry triggers, stop placement, and exit levels ready so execution is mechanical rather than emotional.
Scalping the Squeeze: London Breakout with RSI Divergence Confirmation
On lower timeframes, a classic setup is the EUR/USD London open breakout. Price often compresses during the late Asian session, then breaks in one direction as London liquidity arrives. Rather than buying the first breakout candle blindly, scalpers can wait for a pullback into the broken range and use RSI divergence on the 1-minute or 5-minute chart as confirmation — price making a lower low into the retest while RSI holds higher signals genuine follow-through buying pressure rather than a fakeout. Stop-loss placement sits just beyond the retest wick, keeping risk tight enough that TP1 can realistically sit at a 1:1 or better ratio within minutes. This is precisely the kind of fast-moving setup ScalpHunter is built to flag, surfacing confidence-scored opportunities as the squeeze resolves rather than after the move has already run.
The same logic applies to pin bar reversals during the New York session overlap — a sharp rejection wick off a contracted range, confirmed by momentum divergence, gives scalpers a defined entry with AI-confirmed structure rather than a guess.
Day Trading the Breakout: Inside Bars, Flags, and ATR Stops on Gold
On the hourly and 4-hour charts, the contraction pattern often shows up as a clean inside bar sequence — each candle's range nested inside the previous one. An inside bar breakout entry triggers when price closes beyond the mother bar's high or low, ideally with rising volume or a widening ATR reading confirming genuine expansion rather than noise. Once the breakout is underway, a trend continuation flag pattern frequently forms on the pullback — a small counter-trend consolidation that offers a second, lower-risk entry into the same move.
Stop-loss placement on instruments like XAUUSD deserves particular care because gold's volatility can swing dramatically around US data releases. Rather than using a fixed pip stop, an ATR multiplier approach — typically 1.5x to 2x the current ATR reading below the breakout structure — adapts the stop to actual market conditions instead of an arbitrary number. This is one reason gold setups on the platform frequently show wider stop distances paired with proportionally larger TP2 and TP3 targets, keeping the risk-reward ratio intact even when the dollar-per-pip stop looks large in isolation.
Swing Trading the Expansion: MACD Crossovers and GBP/JPY Stop Sizing
Swing traders working the daily chart look for the same contraction pattern but confirm entries differently. A MACD crossover above the signal line, occurring as price breaks out of a multi-week volatility contraction, adds conviction that the move has real momentum rather than being a single-day spike. From there, a common exit discipline is to hold through TP1 and TP2 but manage the position toward TP3 using a moving average crossover as the invalidation signal — for example, exiting or trailing the stop once the fast MA crosses back below the slow MA on the daily chart, rather than relying on a fixed price target alone.
Pairs like GBP/JPY require deliberate stop sizing given their historically wider average daily range. A stop that works on EUR/USD will often get clipped by normal noise on GBP/JPY. Sizing the stop relative to the pair's own recent ATR — rather than copying a stop distance from a calmer pair — keeps position sizing honest and prevents the account from being stopped out of a structurally sound trade by ordinary volatility.
How This Maps to the Platform's Trade Structure
Every AI-generated analysis on the platform follows the same skeleton regardless of style: a defined entry, a stop-loss level, and three staggered take-profit levels. Conceptually, TP1 represents the first realistic target where a portion of the position can be secured and the stop moved to breakeven; TP2 extends the trade further into the move for traders comfortable holding through minor retracements; TP3 targets the fuller extension of the trend and, by definition, is reached less often than TP1 since it requires the move to sustain longer. This is exactly why scaling out — taking partial profit at each level rather than holding for an all-or-nothing TP3 outcome — tends to produce a smoother equity curve, something you can verify for your own trades on the Trade Tracking dashboard.
What Recent Data Shows
Looking at the past week of tracked activity, daily win rates ranged from 20.0% on the weakest session up to 62.5% on the strongest, with the strongest day also carrying the best average risk-reward ratio at 2.70 and the highest EV score of the period — a reminder that a single strong, well-managed trending day can outweigh several choppier sessions. Averaged across the week, tracked analyses held a win rate near the high-40s with an average RR around 2.0, consistent with setups where partial profits at TP1/TP2 offset the lower hit rate further out at TP3. Zooming out, the platform's all-time win rate across all tracked trades sits at 53.9% with an average RR of 2.01 — a useful long-run backdrop, though any given week (like the volatile stretch above) can swing meaningfully around that baseline. Full historical results, verified against Myfxbook, are visible on the Live Trades Scoreboard as a transparency record of past performance.
The Takeaway
Volatility contraction isn't a single-timeframe phenomenon — it shows up on the 1-minute chart before a London breakout scalp and on the daily chart before a multi-week GBP/JPY swing. What changes between styles isn't the pattern itself but the confirmation tool (RSI divergence, MACD crossover, moving average crossover) and the stop sizing method (tight structural stops for scalps, ATR-multiplier stops for day trades, pair-specific ATR sizing for swings). Traders newer to reading these patterns can build the foundation in the Trading Academy, while common questions about how entries, stops, and TP levels are calculated are addressed directly in the FAQ.
Analytical software only. We do not handle funds, make investments, or provide financial advice. Trading involves substantial risk and past performance does not guarantee future results. Always conduct your own research and consider your risk tolerance before making trading decisions.