Why Swing Traders Need More Than a Line on a Chart
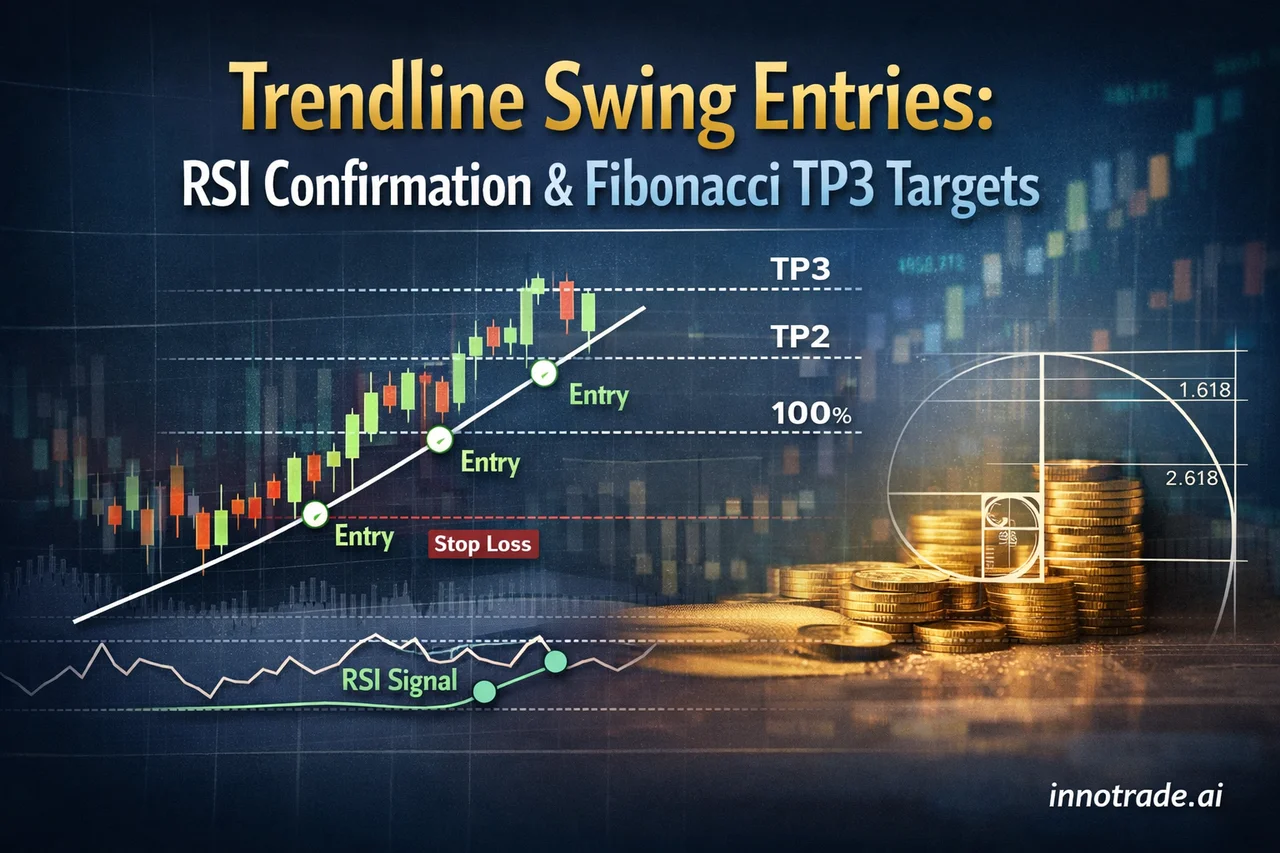
Drawing a trendline is easy. Trusting it enough to risk capital is the hard part. Most swing traders lose money not because their trendline was wrong, but because they entered on the first touch, placed a stop-loss with no logical basis, and had no real plan for where to take profit beyond a vague "somewhere higher." This guide fixes all three problems with a structured approach: a three-touch trendline entry trigger, RSI as a timing filter, structure-based stop-loss rules, and Fibonacci extensions to place a realistic TP3 target.
This isn't theory. We'll walk through how this maps directly onto the entry, TP1/TP2/TP3, and stop-loss structure used in AI-generated analysis on the platform, and we'll ground it in real recent performance data rather than hypothetical backtests.
The Three-Touch Trendline: Building a High-Conviction Entry
A trendline earns credibility with each successful test. The first touch is just a data point. The second touch suggests a pattern. It's the third touch — price approaching the line again and reacting rather than breaking through — that turns a trendline into a valid structural level worth trading. This is the point where swing traders should be watching for an entry trigger, not before.
The key mistake beginners make is entering on touch one or two, when the line hasn't proven anything yet. Waiting for the third touch filters out a huge percentage of false signals, at the cost of occasionally missing the move entirely. That trade-off is worth it — a swing strategy should prioritize quality over frequency.
Structure-Based Stop-Loss Placement
Once the third touch confirms the trendline, the stop-loss should sit behind the most recent swing high or low that defines the trend structure — not an arbitrary pip or point distance. For an uptrend, that means placing the stop just below the higher-low that preceded the third touch. For a downtrend, it sits just above the most recent lower-high. This keeps the stop tied to market structure rather than a round number, which matters because round-number stops are exactly where liquidity tends to cluster and get swept before a genuine reversal.
Adding RSI as a Timing Filter
The three-touch trendline tells you where to look. RSI helps confirm when to pull the trigger. Look for RSI to be exiting oversold territory (below 30) on a bullish third-touch setup, or exiting overbought territory (above 70) on a bearish one. This alignment — structural confirmation from price plus momentum confirmation from RSI — is what separates a coin-flip entry from a genuinely high-conviction one.
If RSI is still deeply oversold or overbought as price hits the trendline for the third time, it's often better to wait for the momentum shift to actually happen rather than anticipate it. Patience at this stage is what keeps the win rate on structure-based entries meaningfully above random chance.
Case Study: Gold's Weekly Pivot and the Three-Touch Setup
Gold has been one of the most heavily analysed instruments on the platform over the past two weeks, generating a high volume of tracked setups with consistent TP1 follow-through and a reasonable share of trades progressing further down the ladder toward TP2 and TP3. Gold's tendency to respect weekly pivot levels makes it a natural fit for the three-touch trendline approach — price often builds a trendline off the weekly pivot and tests it repeatedly across a multi-day swing.
Volatility around high-impact USD data — like the Non-Farm Employment Change or Unemployment Rate releases tracked in our economic calendar — frequently supplies the momentum that either confirms or invalidates a gold trendline setup. Swing traders using this strategy should treat major data releases as catalysts to watch for, not reasons to avoid the trade entirely, since the third-touch-plus-RSI filter already screens out a lot of the noise.
Placing TP3 With Fibonacci Extensions
Once you're in the trade, the question becomes: how far is realistic? For swing trades built off a confirmed trendline structure, the 1.272 and 1.618 Fibonacci extensions of the most recent swing leg give a data-grounded target for TP3, rather than a guess. TP1 can sit near the 0.618–0.786 retracement zone of the prior leg, TP2 near the prior swing high or low, and TP3 extended out to the 1.272–1.618 projection — giving the trade room to run in a genuine trend continuation while still locking in partial profit early.
Staggering Exits Across the Ladder
The value of a three-level TP ladder is that it lets you scale out gradually rather than betting everything on one exit point. TP1 captures a smaller, higher-probability portion of the move; TP2 captures the middle; TP3 is reserved for the trades that genuinely extend into a strong trend. It's normal and expected for follow-through to decline as you move further down the ladder — that's simply the nature of a staggered exit, not a flaw in the strategy. What matters is that each level is placed with a logical basis (retracement zones for TP1/TP2, Fibonacci extension for TP3) rather than arbitrary distances.
What the Data Says About Swing Setups This Week
Looking at the past seven days of tracked analyses, the average win rate across all sessions landed around 62%, with an average risk-reward ratio near 2.26 — a healthy profile for structure-based swing entries. The strongest session by expected value was Tuesday, September 1, which combined an 83.3% win rate with a 3.42 average RR, producing the week's highest EV score. The weakest stretch was Friday, September 4, where win rate dropped to 25.0% and RR compressed to 1.06 — a reminder that even a sound structural approach has losing sessions, and position sizing needs to account for that variance rather than assume every week looks like the best one.
Zooming out, the platform's all-time win rate across all tracked trades sits at 53.8% with an average RR of 2.03 — useful background context showing that the weekly figures above are broadly consistent with, not an outlier from, the longer-term picture.
Putting It Together With AI Analysis
Manually tracking trendline touches, RSI momentum, and Fibonacci extension math across multiple instruments takes time most traders don't have during a live session. This is where AI-generated analysis earns its keep — surfacing structured entry points, a three-level TP ladder, and a defined stop-loss without requiring you to build the chart from scratch every time. If you're newer to reading trendline structure or RSI confirmation, the Trading Academy covers the fundamentals in more depth. Once you're executing trades, the Trade Tracking dashboard lets you monitor how your own swing entries perform against your stated TP1/TP2/TP3 plan over time. For a transparent look at how top-performing setups have actually played out across the platform, the Live Trades Scoreboard shows verified past results — useful as proof of performance, not as a signal source.
Key Takeaway
Don't trade the first trendline touch you see. Wait for a confirmed third touch, align it with an RSI momentum shift, anchor your stop-loss to market structure rather than round numbers, and use Fibonacci extensions to set a TP3 that reflects where the trend could realistically extend. This framework won't win every trade — no framework does — but it replaces guesswork with a repeatable, logical process, and it's the same structural thinking behind the entry, TP, and stop-loss levels generated in every AI analysis on the platform.
Analytical software only. We do not handle funds, make investments, or provide financial advice. Trading involves substantial risk and past performance does not guarantee future results. Always conduct your own research and consider your risk tolerance before making trading decisions.